
Related Topics
View Device Log Messages
After you connect to WatchGuard WebCenter, you can review the log messages sent from your Fireboxes to your WatchGuard Log Server. Log Manager enables you to see log messages from your device for any period of time you specify, if log messages were generated in the selected time frame. To see log messages for a Firebox as they are generated, in real-time, you can use Firebox System Manager Traffic Monitor.
When you first connect to WebCenter, the LOG MANAGER > Devices page appears.
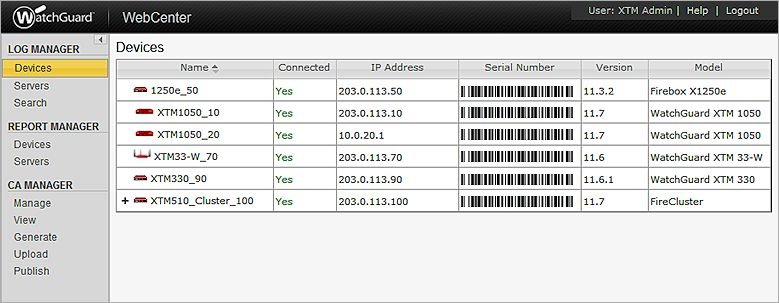
On the Devices page, all of the Fireboxes that send log messages to your WatchGuard Log Server appear. You can select any device to view the log messages for that device, even if the Connected status is No. When you select a device from the Devices list, the log messages page appears with a log frequency graph at the top of the log messages list that shows the range of log message data for your device. The default setting for the log frequency graph is a bar chart, but you can also view the data in a line chart. You can select to view log messages for a predefined time range, or you can specify a custom time range. You can also filter the list of log messages by type.
The information that is available in the log messages list depends on the log type you select.
| Log Type | Result Information |
|---|---|
| Traffic | Disposition, Date-Time, Source, Interface, Destination, Port, Interface, Protocol, Policy |
| Alarm | Date-Time, Alarm Name, Message |
| Event | Date-Time, Process, Priority, Message |
| Diagnostic | Date-Time, Process, Message |
| Statistic | Date-Time, Device, Bytes Received, Bytes Sent |
| All | Type, Date-Time, Detailed Message |
To see the log messages for a device:
- In the Devices list, select the Name of a device.
The log messages page for the selected device appears, with only the Traffic log messages displayed.
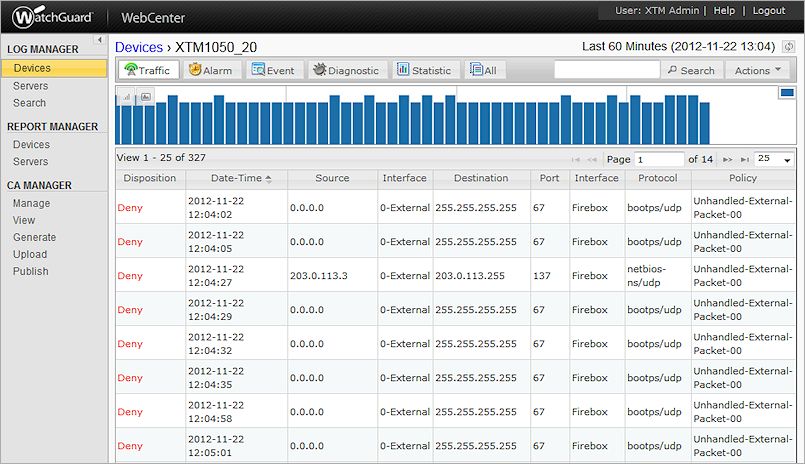
- At the top of the page, click an icon to select the type of log messages to view:
- Traffic
- Alarm
- Event
- Diagnostic
- Statistic
- All
The log messages from the last 60 minutes appear for the log type you selected.
- To select a different time range, from the Actions drop-down list, select a preconfigured time range, or specify a custom time range.
A list of available log messages for the time range you specified appears. - If you selected a predefined time range, click
 to refresh the data in the log message list. This retrieves new data for the specified time range from the moment you refresh the data. does not appear if you have specified a custom time range.
The log message data is updated for the specified time range.
For example, at 12:40 PM you select a 30 Minute time range and all of the available log messages from 12:10–12:40 PM appear for your selected device. After you review the log message data, at 12:50 PM you want to see updated log messages for the last 30 minutes. Click and the log message list updates to include log messages from 12:20-12:50 PM. - To see a line chart of the log message data, click
 .
.
To see a bar chart of the log message data, click .
.
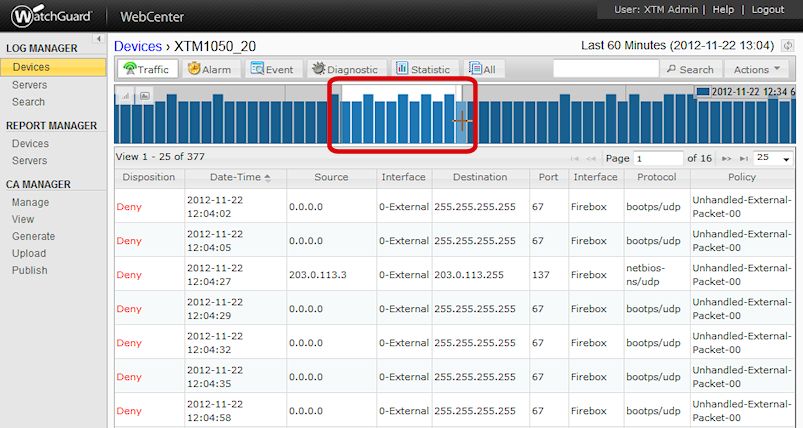
This is the default setting. - To zoom in on a section of the log frequency graph and see a smaller data set, place your mouse cursor over the graph, hold down your left mouse button, and drag the cursor to select a time range.
The log message list is updated based on your new selection and appears on the log frequency graph.
- To zoom out to the original time range, click .
- To see more detailed information about a log message in the list, click that log message.
A dialog box appears with additional information about the log message you selected.
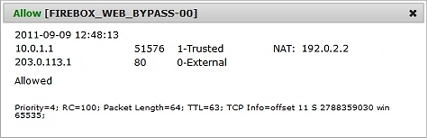
- To copy the content of the message, highlight the message text, right-click the highlighted text and select Copy, or press Ctrl+C on your keyboard.
Search Device Log Messages
You can use the Search feature to refine the log messages that appear for any of your devices. For more information about how to run a search for your devices, see Search Device Log Messages.
See a Timeslice Analysis
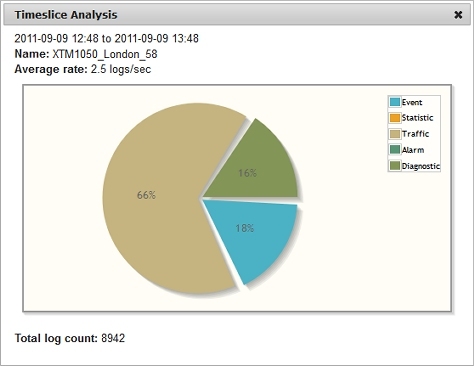
The Timeslice Analysis chart is a pie chart that shows the total number of log messages, the average arrival rate of log messages (per minute or per second), and the percentage of each type of log message sent to the Log Server from a Firebox in the specified time range. The Timeslice Analysis is not available for log messages from your servers.
To see a Timeslice Analysis for a device:
- In the Devices list, select the Name of a device.
The log messages page for the selected device appears, with only the Traffic log messages displayed. - From the Actions drop-down list, select Timeslice Analysis.
The Timeslice Analysis chart appears in a new dialog box.
Export Log Messages
You can export the log messages for any device in the Devices list to a CSV file. When you export log messages, a CSV file is created with the log messages that were available for the device you selected in the time range you specified. This CSV file is automatically added to a ZIP file. The file name of the CSV file included in the ZIP file is the date and time range for the log messages in the file.The ZIP file name is the serial number of the device, as well as the date and time range for the log messages. If you choose to save the ZIP file to a location on your computer, you can specify any file name.
- In the Devices list, select the Name of a device.
The log messages page for the selected device appears. - From the Actions drop-down list, select Export logs (.csv).
An Opening file dialog box appears for the ZIP file. - Select whether to open the ZIP file or save it to a location on your computer.
- Click OK.
- If you save the file, browse to select a location.
- (Optional) Type a file name for the ZIP file.
- Click Save.
The ZIP file is saved to the specified location on your computer. - Browse to the location where you saved the ZIP file and open the file.
- Extract the CSV file.
You can now open the CSV file and review the log messages, or import the CSV file to another program.
See Also
See Log Messages & Reports in WebCenter
Connect to WatchGuard WebCenter