Applies To: Endpoint Security Elite, Endpoint Security 360, Endpoint Security Prime, WatchGuard EDR, WatchGuard EDR Core, Endpoint Security Basic
On the Incident Details page, you can review and analyze the signals that led to the detection of a security incident in the Endpoint Security management UI. A signal is a group of events. An incident includes one or more signals.
Incidents in Endpoint Security are not the same as those in ThreatSync. Incidents in Endpoint Security are a group of signals generated from events on the endpoint. The same incident might also appear in ThreatSync as multiple incidents. For information on how to manage incidents in ThreatSync, go to Perform Actions in ThreatSync.
Your operator role determines what you can see and do in WatchGuard Cloud. Your role must have the Endpoint - Security Manage Incidents permission to view or configure this feature. For more information, go to Manage WatchGuard Cloud Operators and Roles.
To open the Incident Details page, from the Endpoint Security management UI:
- On the Status page, next to My Lists, click Add.
- In the Add List dialog box, select Incidents.
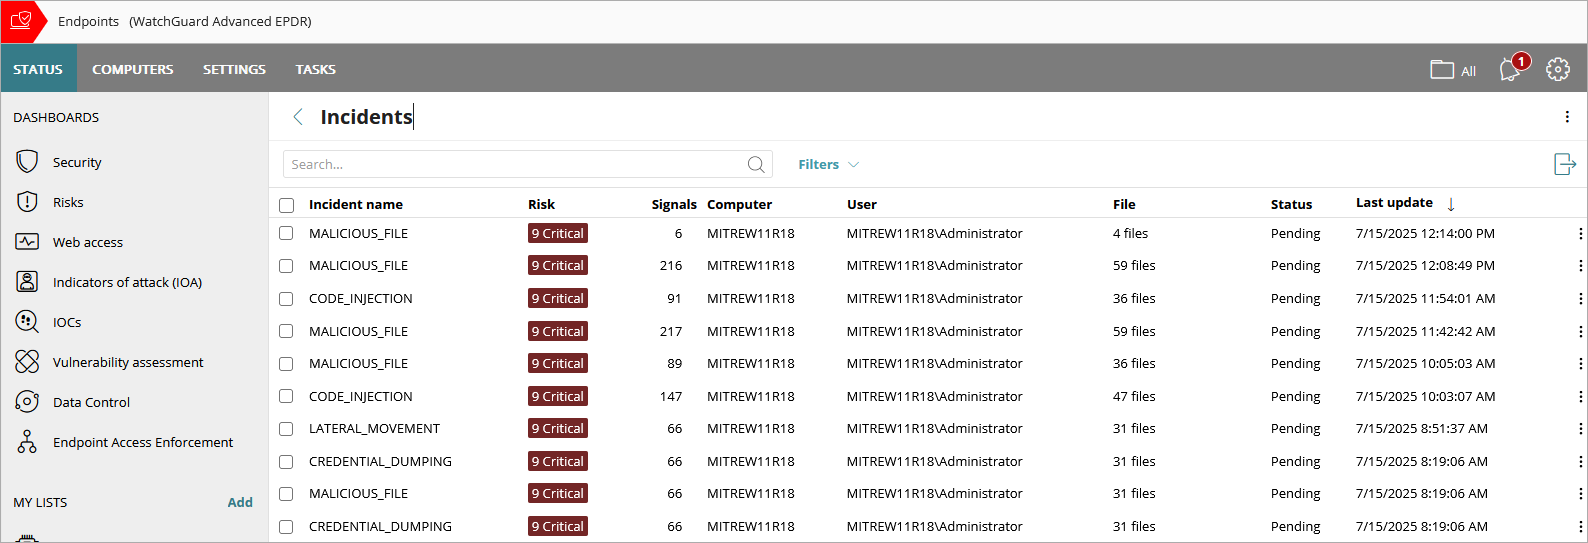
- From the Incidents list, click the name of the incident you want to investigate. You can filter the list to show all incidents with the Action Required status.
If more than one incident is merged into a single incident, then a Merged label shows next to the incident name. Point to the label to show the list of merged incidents. If the incident has changed since it was closed, then an Updated label shows next to the incident name.
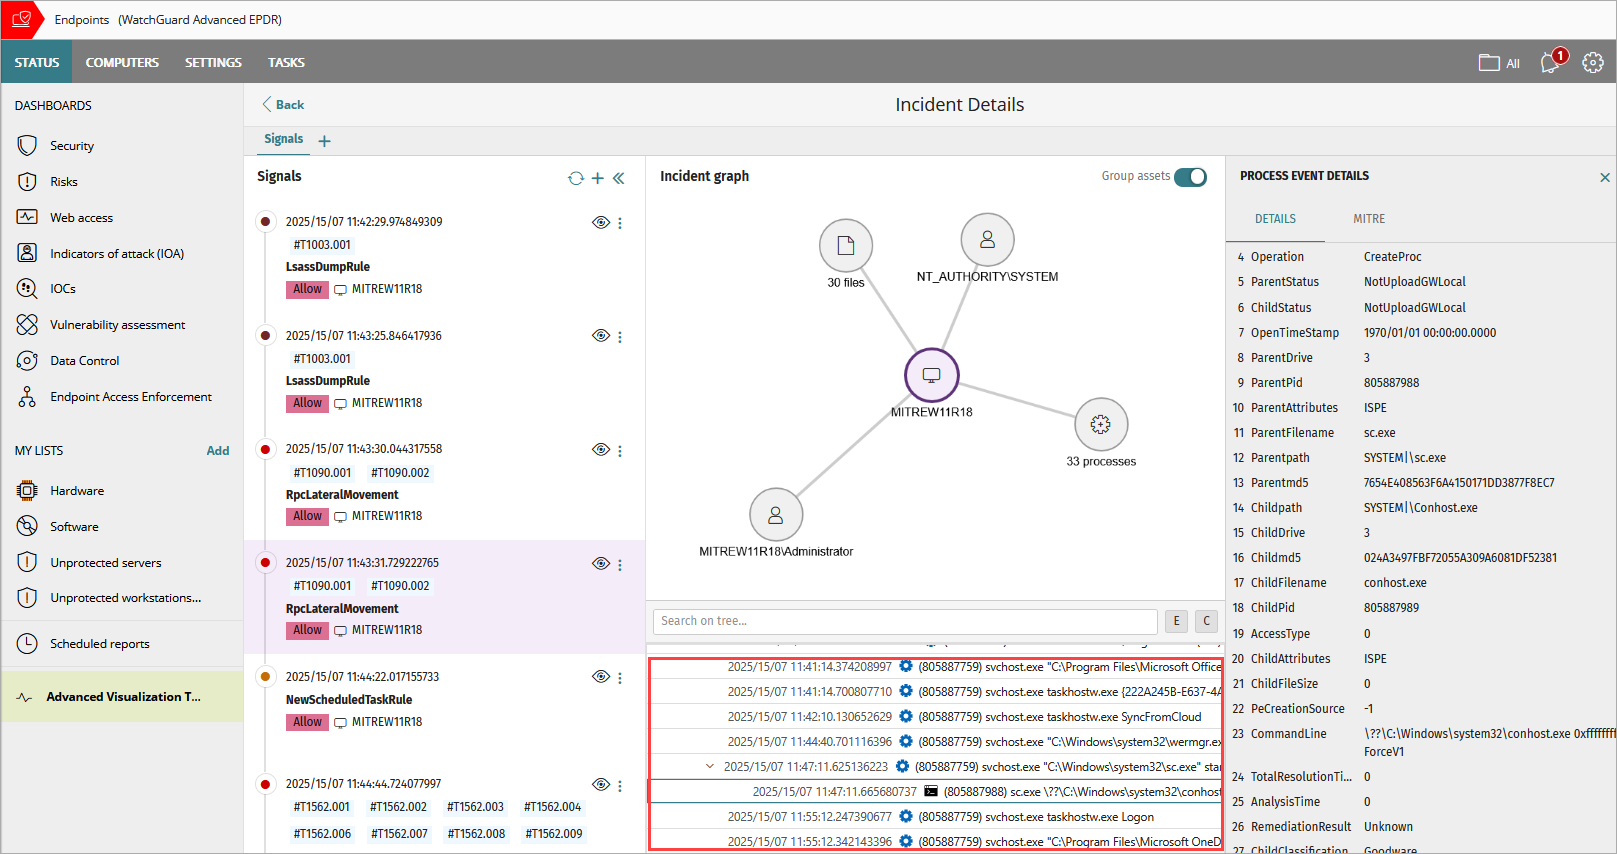
Signals and Signal Details in Endpoint Security
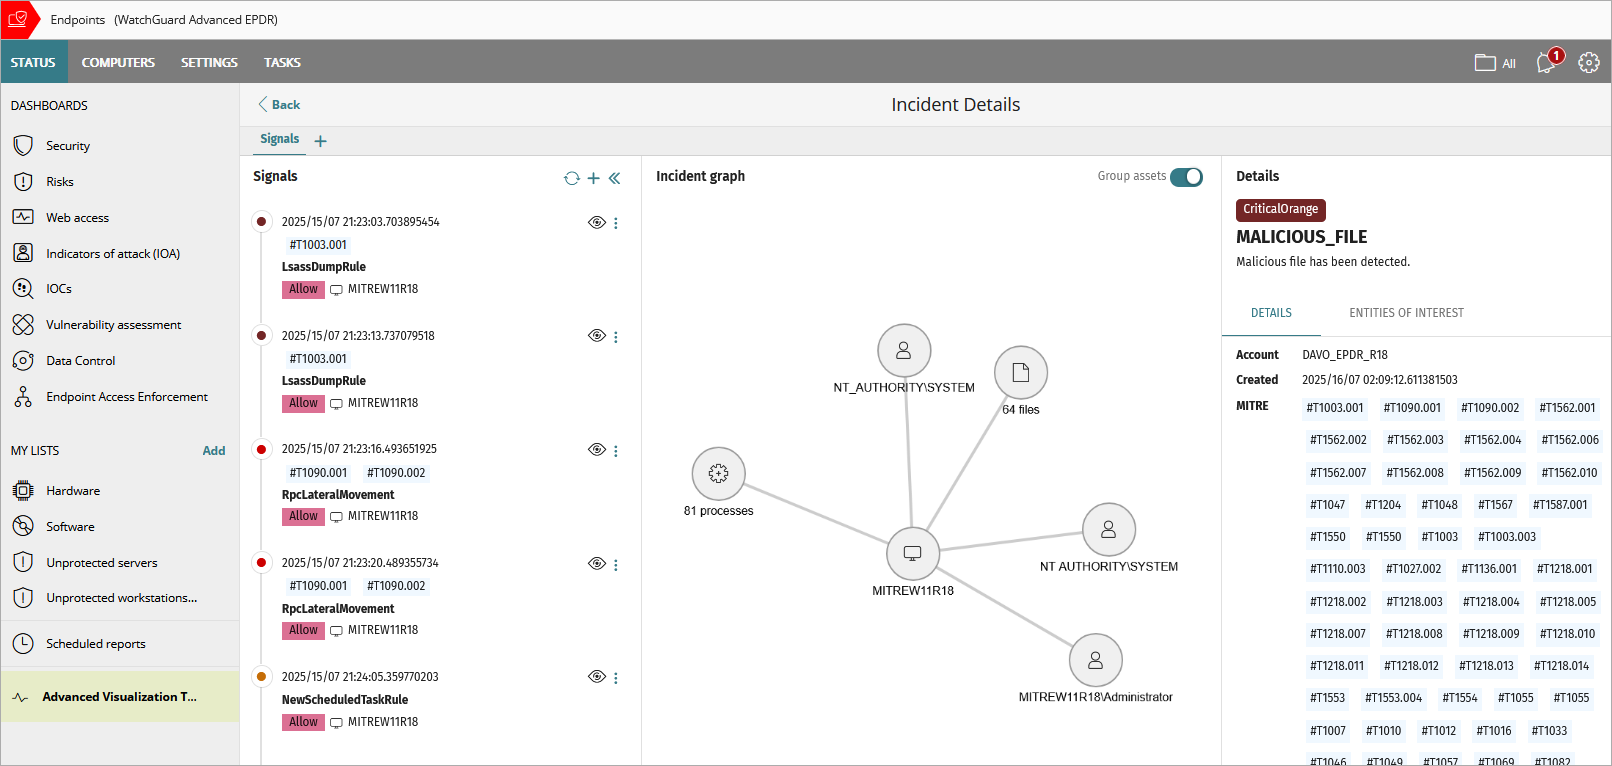
The Incident Details page is divided into three or four sections:
- Signals Pane (left pane)
- Details Pane (right pane)
- Incident Graph (middle pane)
- Process Tree (middle pane)
The Incident Graph and Process Tree are not available in Endpoint Security Basic.
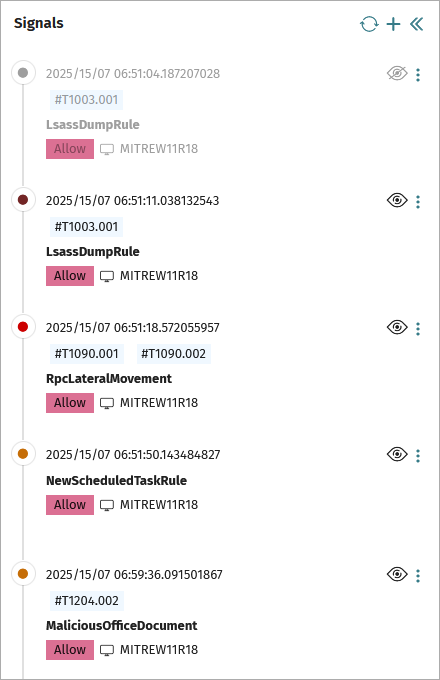
Signals Pane
The Signals pane lists the signals included in the incident. Signals are events that Endpoint Security combines to create an incident. For each signal, you can view the name of the signal defined by Endpoint Security, the date and time when it was detected, the name of the affected device (entity), the MITRE technique (for example, #T1003.001), and any action taken (for example, Allow) by Endpoint Security. When the information is available, the remote IP address of the computer might also show.
The color of the circle next to the signal indicates the risk level:
- Dark red: Risk levels 9 and 10
- Red: Risk levels 7 and 8
- Orange: Risk levels 4, 5, and 6
- Gray: Risk levels 1, 2, and 3
- Green: No risk
In the Signals pane, you can:
- Show and hide signals in the list. When you hide a signal, it also does not appear in the Incident Graph and process tree. To hide a signal, click
 next to the signal. The signal will reappear in the list if it is detected again within 7 days. (This feature is not available in Endpoint Security Basic.)
 - Refresh the list of signals. To refresh the list of signals, click
 . Endpoint Security can add signals to an incident up to seven days after it is created.
 - Add and delete signals from the incident. Click
 . From the Add Signals list, select the signals you want to include in the incident. Click Add. The Incident Graph updates to include the new signals. You can only delete signals that you added manually. (You cannot add or delete signals in Endpoint Security Basic.)
 - Click a signal from the list to review information in the Details pane.
- Start a computer investigation. For more information, go to Create a Computer Investigation. (Endpoint Security Elite only)
- View the computer telemetry associated with the signal in an activity graph. For information on the display, go to Configure Graph Settings. (This feature is not available in Endpoint Security Basic.)
- Exclude a signal and do not detect it again. Select the signal and then click
 . Select Do Not Detect Again. When you exclude a signal, it shows in the Detected Items Allowed by the Administrator tile and list. When you exclude a malware item that was quarantined, it is restored to its original location. When you exclude an IOA signal, it becomes an automatic IOA deletion rule. You can modify the exclusion rule. For more information, go to Add a Signal Exclusion and Automatic Deletion Rule.
 - View computer details. For more information, go to Computer Details in Endpoint Security.
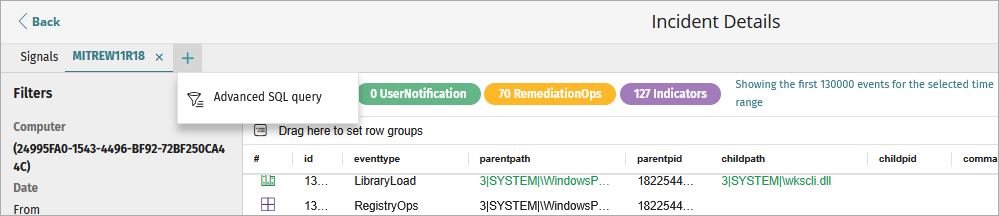
With Endpoint Security Elite, operators can also click ![]() above the list to create an SQL query of the event telemetry logged on the affected computer or use the GenAI Assistant. For more information, go to About the Advanced SQL Query Tool and About the GenAI Assistant in Endpoint Security.
above the list to create an SQL query of the event telemetry logged on the affected computer or use the GenAI Assistant. For more information, go to About the Advanced SQL Query Tool and About the GenAI Assistant in Endpoint Security.
Details Pane
The Details pane shows detailed information specific to the incident or a selected signal. When you select a signal and then select a process from the process tree, the Details pane shows process event information. For information on the process tree, go to Process Tree.
The Details pane for an incident includes Details and Entities of Interest tabs.
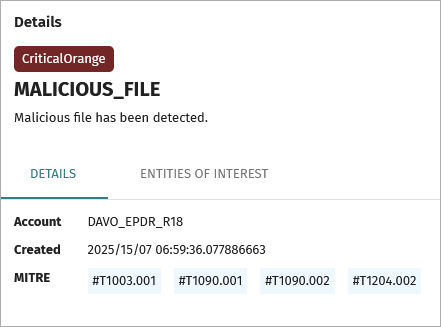
Details Tab
The Details tab shows the affected account name, date and time when the incident occurred, and any identified MITRE techniques. Point to a MITRE technique to show information about the technique.
Entities of Interest Tab
On the Entities of Interest tab, you can review a list of components directly involved or affected by the signal. Entities of interest contain the information that Endpoint Security uses to generate signals, as well as other details gathered from the analysis performed by the security software.
From the Entities of Interest tab, click ![]() to:
to:
- Copy the name of the entity (computer, user, or file name).
- Start a computer investigation. For more information, go to Create a Computer Investigation. (This feature is only available in Endpoint Security Elite.)
- View the computer details for the affected computer. For more information, go to Computer Details in Endpoint Security.
- Start an assisted investigation to view information about the events logged on the computer through interactive searches and results. (This feature is only available in Endpoint Security Elite.)
- View static file information (binary files only).
Signal Details
When you select a signal from the list, the signal name appears at the top of the Details pane, followed by the raw data received by Endpoint Security for the signal.
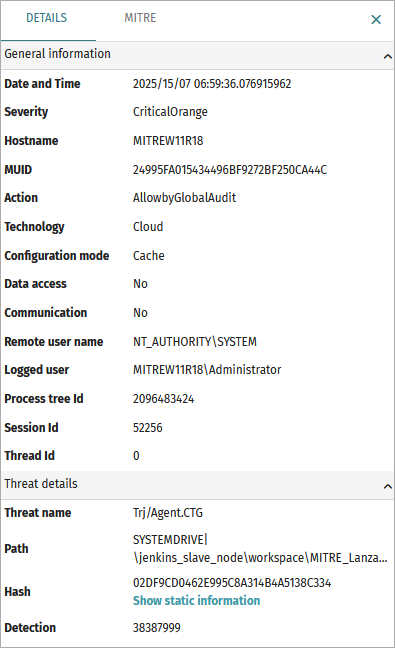
The data that appears on the Details tab varies based on the incident and the data received for that signal. The Details tab could include this information:
- General Information — Information includes the computer the signal was detected on, the date and time of detection, and whether the threat accessed data or communicated externally.
- Threat Details — Information for signals generated from detection of malware, PUPs, exploits, vulnerable drivers, and other attacks.
- Related Event — Information about events that led to the generation of the signal.
- Reclassification Information — Information about classification of an unknown item.
- Evidence Data — Information about the context in which an indicator of attack was detected.
- Exploit Information — Information about the context in which an exploit attack was detected.
- Network Attack Information — Information about the remote computer that carried out a network attack.
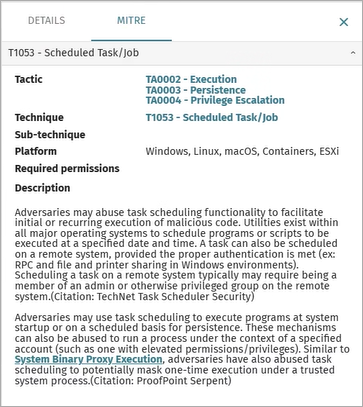
On the MITRE tab, you can review a list of the MITRE techniques used in the signal. Click a link to review more information on the MITRE website. The MITRE tab only shows when the signal has MITRE techniques and sub-techniques assigned.
Incident Graph
The Incident Graph is not available in Endpoint Security Basic.
The Incident Graph is a visual representation of the assets related to the incident. To simplify the graph and group affected assets of the same type in a circle, enable the Group Assets toggle. The number of assets in the group shows below the circle (for example, 4 files, 3 processes).
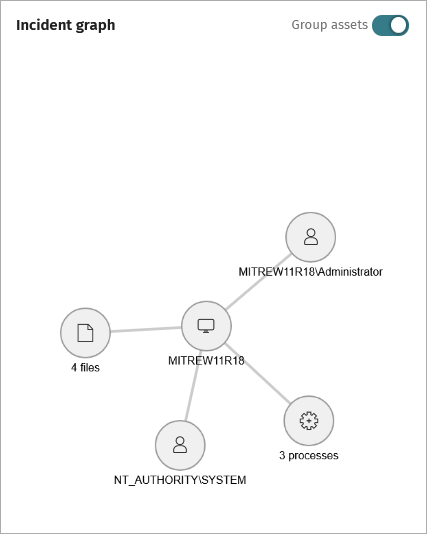
Assets that could show in the Incident Graph include:
- Logged-in user
- Remote user
- Computer
- Remote computer
- Process
- IP address
- File
Right-click the Incident Graph and select an option to:
- Hide signals from the incident.
- View computer details for the affected computer. For more information, go to Computer Details in Endpoint Security.
To remove an entity of interest from the graph, in the Incident Graph, right-click the entity of interest and select Hide Related Signals.
Process Tree
The process tree is not available in Endpoint Security Basic.
The process tree below the Incident Graph shows the sequence of events that generated the signal, the signal, and its severity. Endpoint Security includes processes logged up to seven days before the signal was generated in the process tree.
When you select a line from the process tree, information on the process event shows in the Details pane. To review information about the signal, select the process tree line with the ![]() icon.
icon.
To search for a specific process, type the name of a process (for example, svchost.exe) in the search text box. The tree shows only processes that contain the text you entered.
To expand all child processes in the tree, click E above the tree. To collapse the tree and show only parent processes, click C above the tree.
To expand and collapse a process and child processes in the tree, click the arrow on the left side of a parent process.
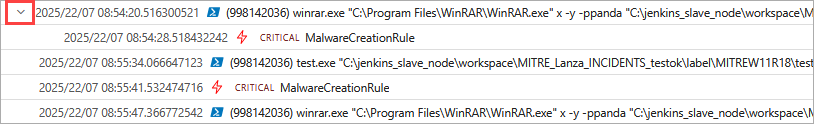
In the process tree, each event includes this information:
- Date and time when the child event was created or the signal was logged
- Parent process identification number (for example, 998142036)
- Parent process name (for example, winrar.exe, or svchost.exe)
- Child process name (for example, taskhostw.exe logon)
- Severity of the signal (for example, Critical, High, Medium, Low, No Risk)
- Name of the signal (for example, MalwareCreationRule)
Manage Incidents in Endpoint Security
Create a Computer Investigation