Applies To: WatchGuard Core MDR, WatchGuard Core MDR for Microsoft, WatchGuard Total MDR, WatchGuard Open MDR
For both Service Providers and Subscribers, the Managed Services portal Dashboard provides a quick overview of key metric data with links to more details.
The data you see depends on your WatchGuard MDR license. If your environment does not have an applicable license, the tile shows a lock icon. For more information, go to About WatchGuard MDR Licenses.
If no data shows in the Managed Services portal, the service is active but no detections have occurred. The portal shows data only after an event with potential security implications is detected. After you allocate users from the WatchGuard MDR license, it might take up to six hours for activity to show in the portal.
Service Provider Dashboard
The Service Provider Dashboard shows aggregate data for your managed accounts. To view the data for one of your accounts, select the account from the drop-down list.
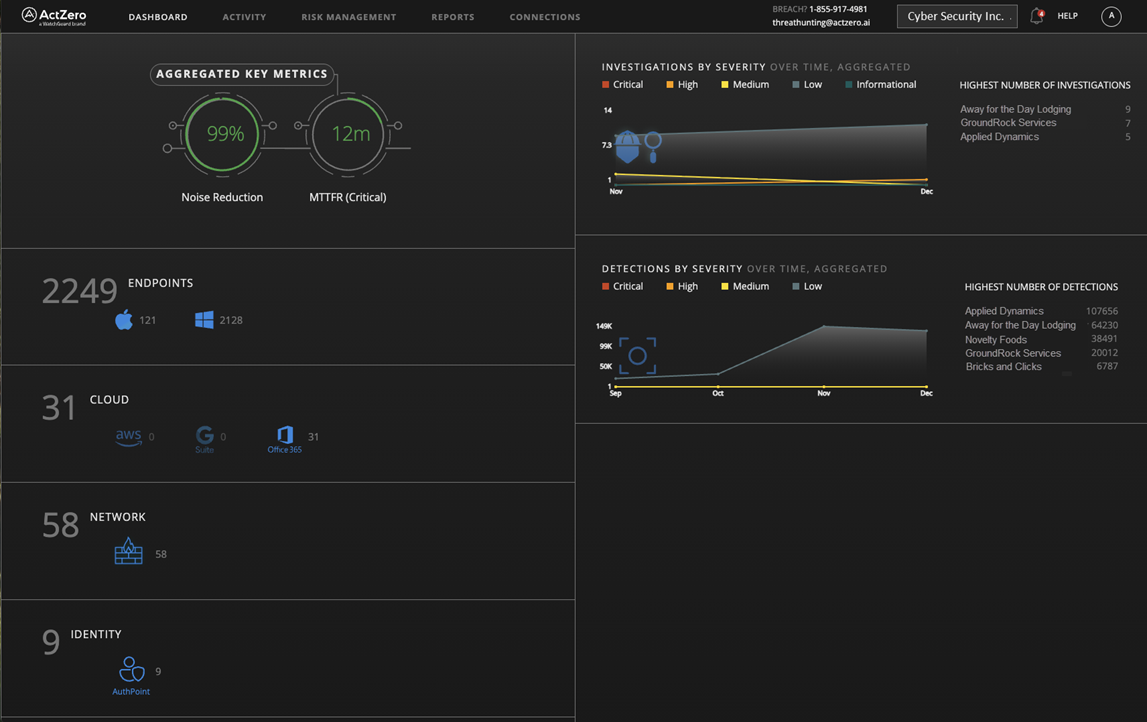
The Service Provider dashboard includes these tiles:
- Aggregated Key Metrics
- Endpoints
- Cloud
- Network
- Identity
- Investigations by Severity
- Detections by Severity
Aggregated Key Metrics
The Aggregated Key Metrics tile shows metrics across all of your managed accounts.
Noise Reduction
Shows the percentage of detections that are filtered because they do not merit alerts. For example, some low-severity detections are filtered because they are false positives.
MTTFR (Critical)
Shows the MTTFR (mean time to first response). This is the average time from the discovery of a critical-severity detection to the time when WatchGuard MDR initiates a response. This is a global average across all WatchGuard MDR customers.
Endpoints
The Endpoints tile shows the number of active endpoints (computers and servers) across your managed accounts that send data to WatchGuard MDR. This might include data from WatchGuard Endpoint Security products, Microsoft Defender, and CrowdStrike EDR. The tile also shows a breakdown of endpoints by operating system.
Cloud
The Cloud tile shows the number of connected integrated cloud services across your managed accounts. Depending on your license and connected services, this might include Microsoft 365, AWS CloudTrail, and Google Workspace.
Network
The Network tile shows the total number of network devices across your managed accounts that are connected and have sent data. This includes data for WatchGuard Fireboxes, FireCloud, WatchGuard NDR, and supported third-party firewalls.
Identity
The Identity tile shows the number of users across your managed accounts who authenticate with connected identity providers, such as AuthPoint.
Investigations by Severity
The Investigations by Severity Over Time, Aggregated tile shows instances where WatchGuard MDR or a security analyst detects potentially malicious activity and initiates an investigation for your managed accounts. Investigations contain contextual information and details that help you and WatchGuard MDR take action to protect your environment.
The tile also shows the managed accounts with the Highest Number of Investigations.
To open the Investigations page and view the details, click the tile.
Detections by Severity
The Detections by Severity Over Time, Aggregated tile shows security detections across your managed accounts. Detections are events with potential security implications. WatchGuard MDR automatically blocks the source of detections or manually investigates detections, as needed.
The tile also shows the managed accounts with the Highest Number of Detections.
To open the Detections page and view the details, click the tile.
Subscriber Dashboard
The Subscriber Dashboard shows key metric data for a rolling 90-day window.
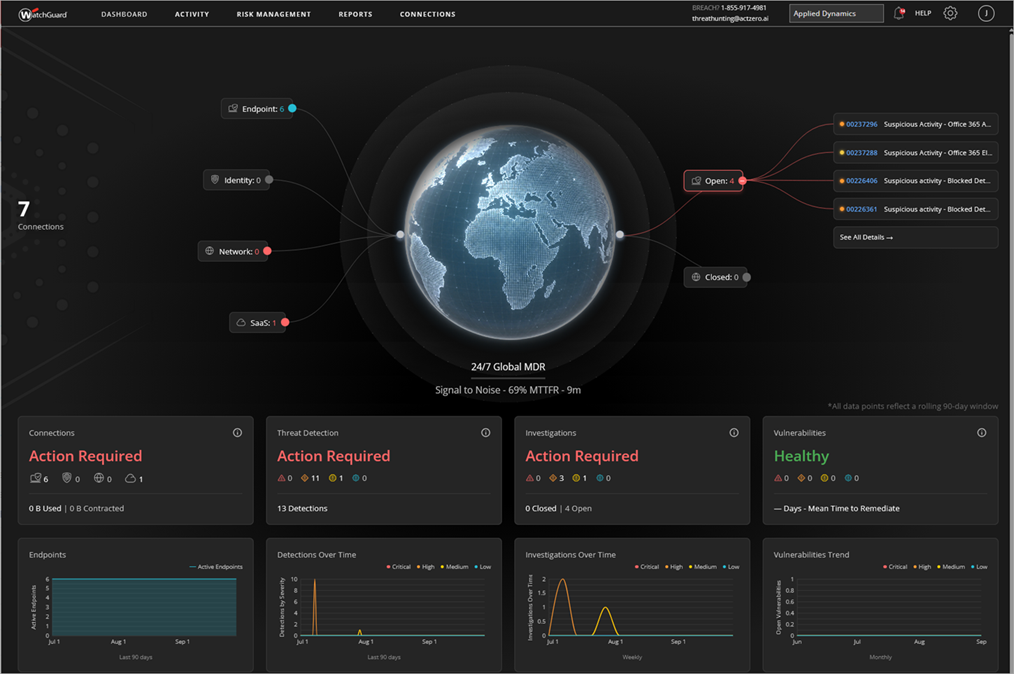
The Subscriber dashboard includes these sections and tiles:
- Overview
- Connections
- Threat Detection
- Investigations
- Vulnerabilities
- Endpoints
- Detections over Time
- Investigations over Time
- Vulnerabilities Trend
Some tiles show a status based on the highest severity item for that metric (for example, detections) in the rolling 90-day window:
Healthy
There are no Critical, High, or Medium severity items. Low and Informational severity items do not affect the status.
Review
There is at least one Medium severity item but no High or Critical severity items.
Action Required
There is at least one Critical or High severity item.
Overview
The overview globe shows a summary of connections and investigations for your environment.
On the left, the globe shows the total number of Connections and a breakdown by category:
- Endpoint — Computers and servers that are managed by WatchGuard MDR. This includes endpoints that run Endpoint Security, Microsoft Defender, and CrowdStrike EDR.
- Identity — Users who authenticate with supported identity providers. Depending on your MDR license, this might include AuthPoint, Okta, and Duo.
- Network — Network devices such as WatchGuard Fireboxes, FireCloud, WatchGuard NDR, and supported third-party firewalls.
- SaaS — Integrated cloud services in your environment. Depending on your MDR license and connected services, this might include Microsoft 365, AWS CloudTrail, and Google Workspace.
On the right, the globe shows open and closed investigations. Select Open or Closed to view investigation details. To open the Investigations page, click See All Details.
The dashboard also shows these metrics:
Signal to Noise
Shows the percentage of detections for the environment that were filtered because they do not merit alerts. For example, some low-severity detections are filtered because they are false positives.
MTTFR
Shows the MTTFR (mean time to first response). This is the average time from the discovery of a critical-severity detection to the time when WatchGuard MDR initiates a response. This is a global average across all WatchGuard MDR customers.
All data points on the Subscriber dashboard reflect a rolling 90-day window.
Connections
The Connections tile shows the connection status for your environment. The status can be Healthy or Action Required. The tile also shows the number of connections over the last 90 days for endpoints, network devices, cloud services, and identity-provider users.
To open the Service Status page and view the details, click the tile.
Threat Detection
The Threat Detection tile shows the overall threat detection status for your environment. The status can be Healthy, Review, or Action Required. The tile also shows detections by severity, the total number of detections, and the endpoint block rate.
To open the Detections page and view the details, click the tile.
Investigations
The Investigations tile shows instances where WatchGuard MDR or a security analyst detects potentially malicious activity and initiates an investigation. Investigations contain contextual information and details that help you and WatchGuard MDR take action to protect your environment.
The status can be Healthy, Review, or Action Required. The tile also shows investigations by severity and the number of open and closed investigations.
To open the Investigations page and view the details, click the tile.
Vulnerabilities
The Vulnerabilities tile shows the overall vulnerability status for your environment. The status can be Healthy, Review, or Action Required. The tile also shows vulnerabilities by severity and the Mean Time to Remediate (MTTR).
To open the Vulnerabilities page and view the details, click the tile.
Endpoints
The Endpoints tile shows the number of active endpoints for the last 90 days.
Detections over Time
The Detections over Time tile shows detection trends by severity for the last 90 days.
Investigations over Time
The Investigations over Time tile shows investigation trends for the last 90 days. If no investigation trend data is available, the tile shows No trend data available.
Vulnerabilities Trend
The Vulnerabilities Trend tile shows vulnerability trends for the last 90 days. If no vulnerability trend data is available, the tile shows No trend data available.