Applies To: Locally-managed Fireboxes
To run diagnostic tasks for your Firebox:
- Select System Status > Diagnostics.
The Diagnostics page opens with the Diagnostics File tab selected. - Select the Network tab.
The Network page opens.
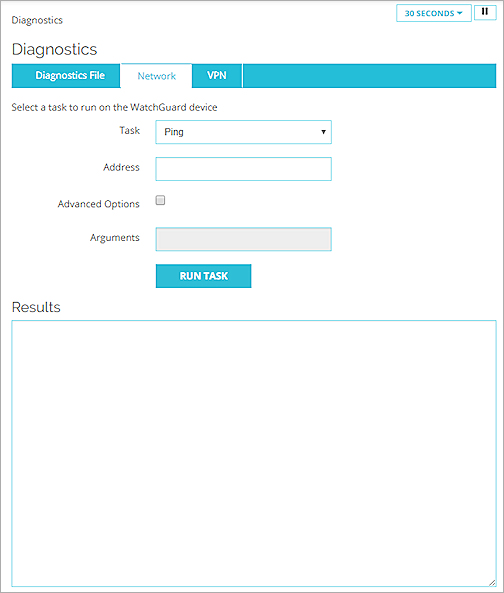
- Run a diagnostic task, as described in the next sections.
Run a Basic Diagnostics Command
- From the Task drop-down list, select a command:
- Ping
- traceroute
- DNS Lookup
- TCP Dump
If you select Ping, traceroute, or DNS Lookup, the Address text box appears.
If you select TCP Dump, the Interface text box appears.
- If you select Ping, traceroute, or DNS Lookup, in the Address text box, type an IP address or host name.
If you select TCP Dump, from the Interface drop-down list, select an interface. - Click Run Task.
The output of the command appears in the Results window and the Stop Task button appears. - To stop the diagnostic task, click Stop Task.
Use Command Arguments
- From the Task drop-down list, select a command:
- Ping
- traceroute
- DNS Lookup
- TCP Dump
- Select the Advanced Options check box.
The Arguments text box is enabled and the Address or Interface text box is disabled. - In the Arguments text box, type the command arguments.
To see the available arguments for a command, leave the Arguments text box empty.
For information on TCP dump arguments, go to TCP Dump Command Arguments. For information on Ping arguments, go to Ping Linux Man Page.
- Click Run Task.
The output of the command appears in the Results window and the Stop Task button appears. - To stop the diagnostic task, click Stop Task.
Find the IP Address for a Host Name
From your Firebox, you can use the DNS Lookup task to find which IP address a host name resolves to.
To find the IP address for a host name:
- From the Task drop-down list, select DNS Lookup.
The Address text box appears. - In the Address text box, type the host name.
- Click Run Task.
The IP address for the host name you specified appears in the Results list.
Download a PCAP File
From the Diagnostics page, you can download a packet capture (PCAP) file to help you diagnose problems with the traffic on your network. The PCAP file captures the results of the most recent TCP dump task that you run so you can review the protocols found in the task results outside of the Diagnostics page. If you do not save the TCP dump results to a PCAP file, the results of the TCP dump task are cleared when you run a new diagnostic task.
When you enable the Advanced Options to include arguments in the TCP dump task, you must always specify an interface. This can be a physical interface on the Firebox (such as, eth0), a Link Aggregation interface (such as, bond0), a wireless interface (such as, ath0), or a VLAN interface (such as, vlan10). If you specify a VLAN or bridge interface, and the traffic matches a proxy rule, TCP dump only captures the first incoming packet on that interface. To capture all packets, you must run the TCP dump task on the physical interface from where the packets originate.
When you create the PCAP file with the TCP dump data, you choose whether to save the file or open it. To open the PCAP file, use a third-party application, such as Wireshark. You can then review the protocols included in the file and resolve issues in your network configuration.
The maximum size of the PCAP file is 30 MB. If your Firebox has limited memory, the size of the PCAP file is constrained relative to the memory available on your device.
To save the TCP dump data directly to a PCAP file:
- From the Task drop-down list, select TCP Dump.
The Interface drop-down list appears. - Select the Advanced Options check box.
The advanced options appear.
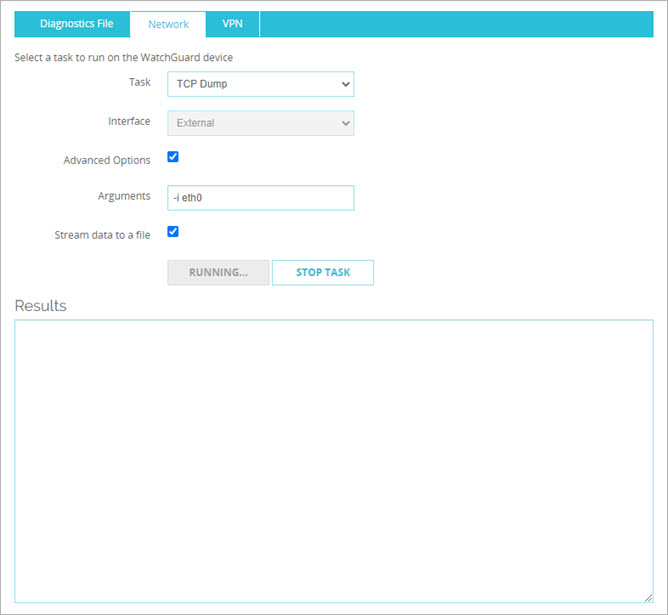
- In the Arguments text box, type the parameters for the search. Parameters are case sensitive.
For example, to capture PCAP data for the default external interface, type -ieth0 or -i eth0. - Select the Stream data to a file check box.
- Click Run Task.
The task runs and the Stop Task button and Open or Save File dialog box appear. - Save or open the PCAP file.
If you choose to save the PCAP file, specify a location to save the file and a name for the file.
If you choose to open the PCAP file, select the third-party application to use to open the file. - Click OK.
- When the TCP dump has collected enough results, click Stop Task.
TCP Dump Command Arguments
To see information about the packets transmitted across your network (TCP dump), in the Arguments text box, you can type these command arguments:
tcpdump [-aAbdDefIKlLnNOpPqRStuUvxX] [ -B size ] [ -c count ] [ -E algo:secret ] [ -i interface ] [ -M secret ] [ -s snaplen ] [ -T type ] [ -y datalinktype ] [ expression ]
The parameters in TCP dump commands are case-sensitive.
For example:
- To see all port 443 traffic on the eth0 interface, type -i eth0 port 443. In this example, to capture packets on an interface, type:
- -i to filter packets on an interface.
- port to filter data on a port.
- To see all the port 53 traffic on the eth1 interface from or to the 10.0.1.10 internal server, type -i eth1 host 10.0.1.10 and port 53. In this example, type:
- host to filter data for a host.
- port to filter data on a port.
- To see all traffic, except port 53 traffic, on the vlan2 interface to or from the 10.0.2.20 internal server, type -i vlan2 host 10.0.2.20 and not port 53. In this example, to exclude all data from port 53, add the condition not.
- To see all IPSec traffic on the eth0 interface to or from a remote host, type - i eth0 host 203.0.113.50 and (port 500 or port 4500 or esp).
- To limit the capture to four packets on the eth0 interface, type -i eth0 -c 4. In this example, to limit the capture of packets, type -c.
For more information on TCP dump arguments, go to tcpdump.org.
For more information about the System Status pages, go to Monitor your Firebox with Fireware Web UI.
Firebox TCP Dump Diagnostics video tutorial (7 minutes)