Applies To: Locally-managed Fireboxes
FireWatch is a real-time, interactive report tool, available in Fireware Web UI and WatchGuard Dimension, that groups, aggregates, and filters statistics about the traffic through your Firebox in an easy-to-understand form. FireWatch includes many options to pivot, refine, and filter information about your firewall traffic. Some of the information you can see at a glance includes:
- Top Users
- Top Domains
- Application Usage
- Bandwidth Usage
- Firewall Traffic
- Security Service Activity
- Device State
You can use FireWatch to see:
- Who uses the most bandwidth on your network
- Which is the most popular site that users visit
- Which sites use the most bandwidth
- Which applications use the most bandwidth
- Which sites has a particular user visited
- Which applications are most used by a particular user
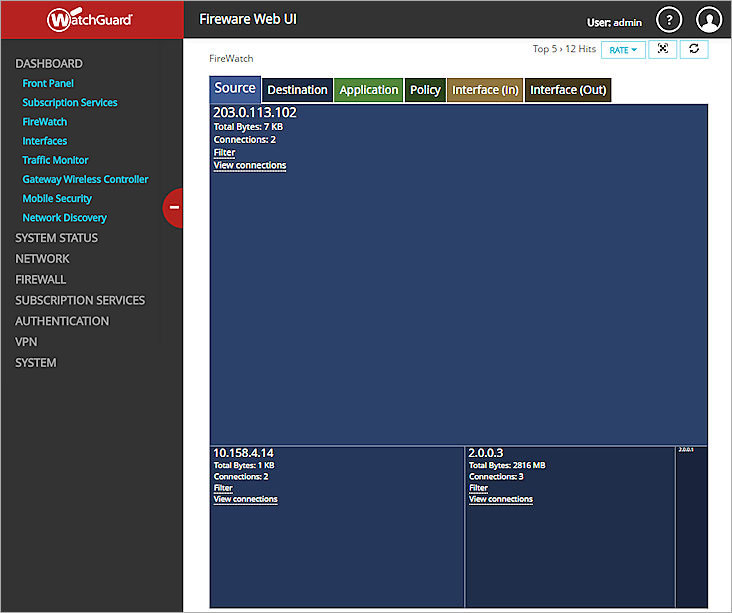
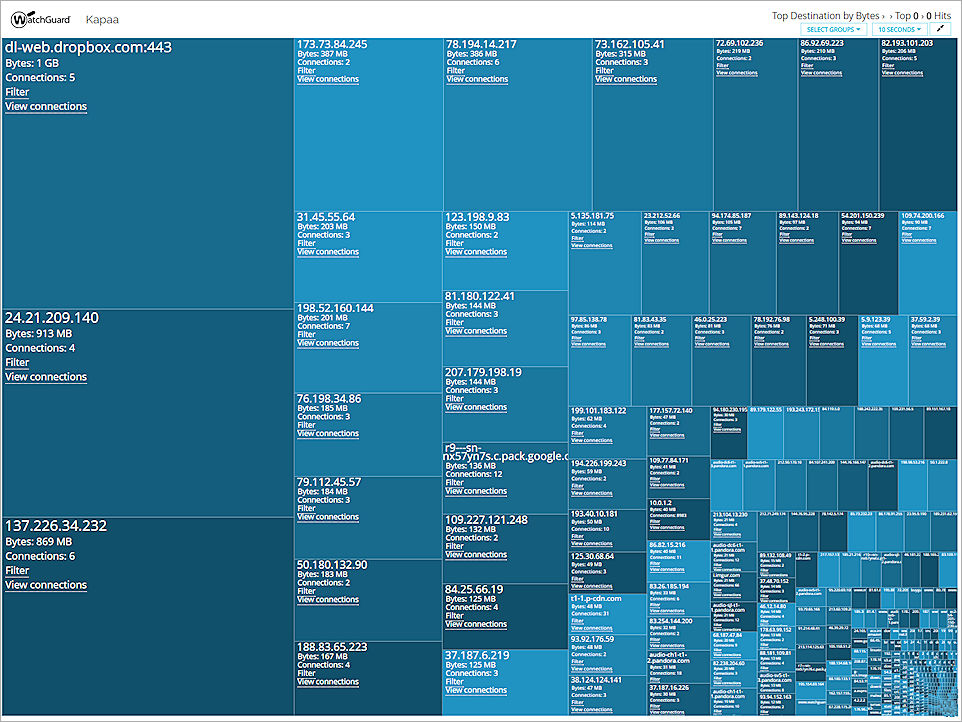
The FireWatch page is separated into tabs of data that is presented in a Treemap Visualization. The treemap is a widget that proportionally sizes blocks in the display to represent the data for that tab. The largest blocks on the tab represent the largest data users. The data is sorted by the tab you select and the type you select from the drop-down list at the top right of the page.
FireWatch includes these tabs:
Source
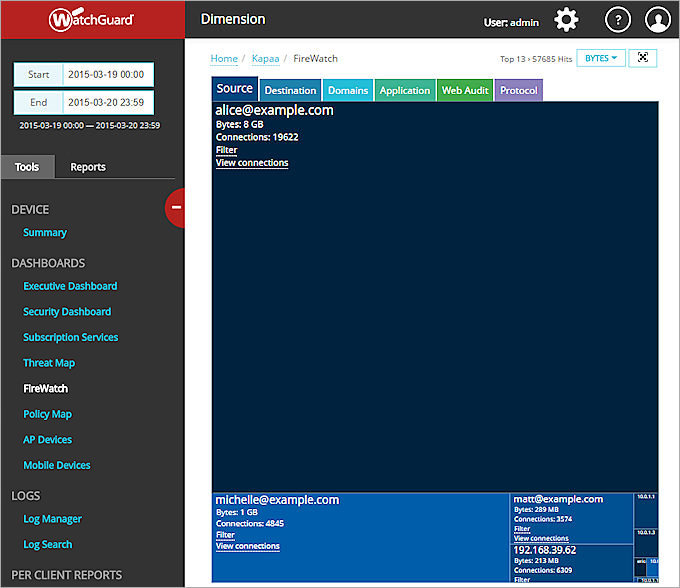
On the Source tab, you can see all the user and host addresses where traffic through the Firebox originates. You can pivot the data on the Bytes or Connections.
In Dimension, source information appears in the treemap in blue.
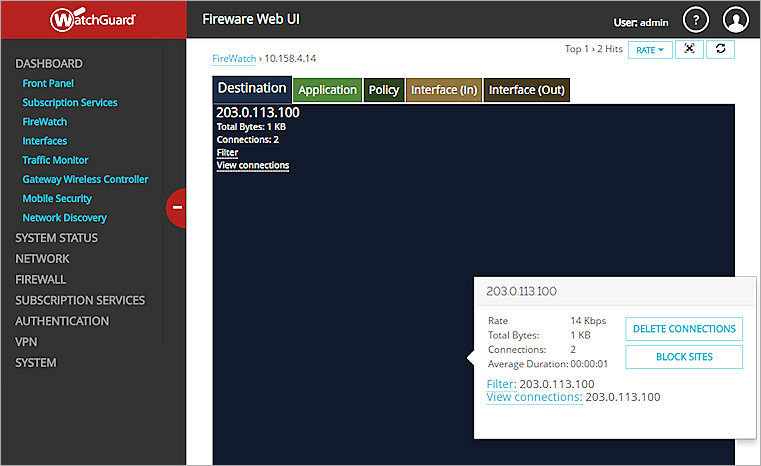
Destination
On the Destination tab, you can see all the addresses where the traffic through the device terminates. You can pivot the data on the Bytes or Connections.
In Dimension, destination information appears in the treemap in blue.
Domains
(Dimension Only)
On the Domains tab, you can see all the domains visited over the selected time range. Domain names are aggregated from the visited host names. For example, google.com appears for traffic to gmail.google.com. You can pivot the data on the Bytes or Connections.
Domain information appears in the treemap in blue.
Domain information might not show unless client traffic uses a proxy.
Application
On the Application tab, you can see an aggregate view of all the applications currently in use. You can view the data based on the number of connections.
In Dimension, application information appears in the treemap in green.
Web Audit
(Dimension Only)
On the Web Audit tab, you can see all the WebBlocker categories in use over the selected time range. You can view the data based on the number of connections.
Web Audit information appears in the treemap in green.
Protocol
(Dimension Only)
On the Protocol tab, you can see an aggregate view of all the protocols in use over the specified time range. You can view the data based on the number of connections.
Protocol information appears in the treemap in brown.
Policy
(Fireware Web UI Only)
On the Policy tab, you can see an aggregate view of all policies that are applied to the current traffic through the device. You can view the data based on the number of connections.
Interface (In)
(Fireware Web UI Only)
On the Interface (In) tab, you can see all the connections through the active inbound interfaces on the device.
Interface (Out)
(Fireware Web UI Only)
On the Interface (Out) tab, you can see all the connections through the active outbound interfaces on the device.
On each FireWatch tab, you can pivot the data on these details:
- Rate
(Fireware Web UI Only) - Bytes
- Connections
- Duration
(Fireware Web UI Only)
See Connection Details
On any FireWatch tab, you can see detailed information for any active connection. The number of active connections for the data type you select appears at the top right of the FireWatch page, adjacent to the data type selection drop-down list and refresh button.
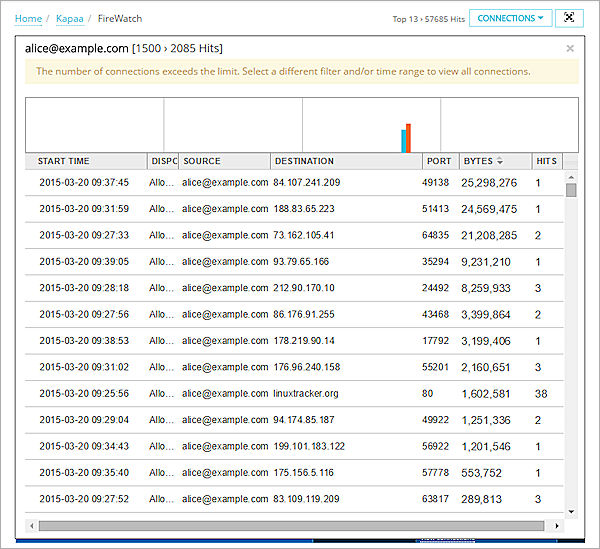
When you view the connections for an item in the Dimension treemap, a bar chart appears at the top of the connections list. The color of each bar indicates the type of data:
- Blue — Number of hits
- Green — Bytes transferred
When you view connection details, if the source is a mobile device, the mobile device information appears in the Source column of the connection details.
To see details for active connections to your device, from Fireware Web UI:
- In the Dashboard section, select FireWatch.
The FireWatch page appears, with the Source tab selected by default. - Select a tab.
The current connections appear.
- To change the type of data that appears in the selected tab, from the drop-down list at the top right of the page, select an option:
- Rate
- Bytes
- Connections
- Duration
Not all options are available for all connection types.
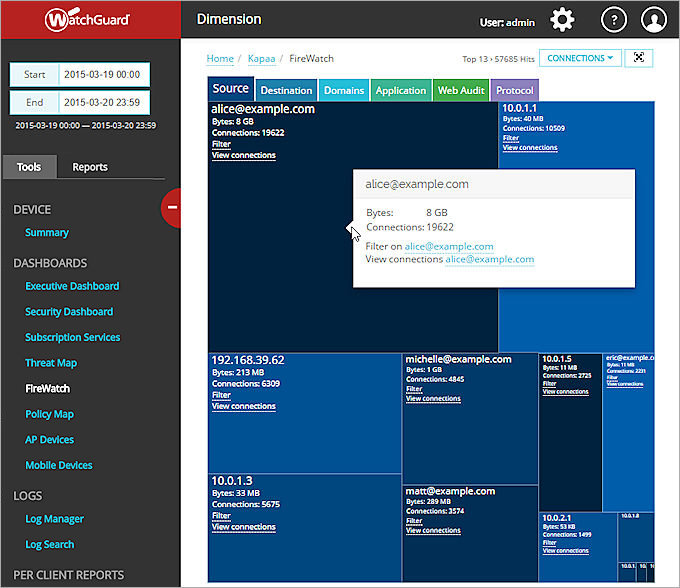
The data in the display is updated based on the option you selected. - To see details about any item in the treemap, place your cursor over the item.
The connection details dialog box appears.
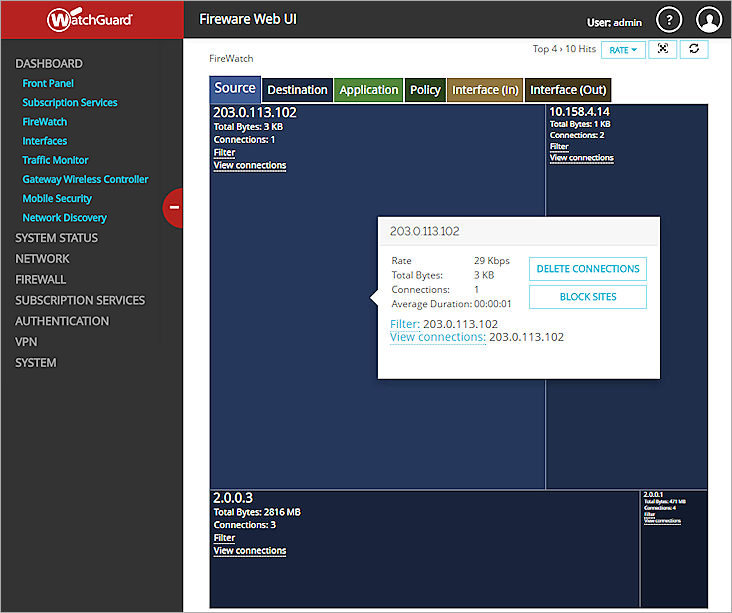
- To see all connections for an item, in the connection details dialog box, click View connections.
The connections dialog box appears.
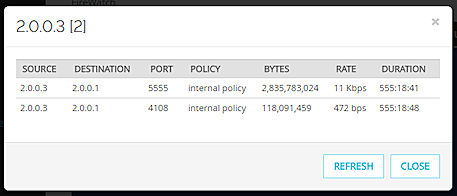
- To update the list of connections, click Refresh.
The connections list is updated with the most recent data. - To filter the information that appears in the treemap by the selected connection, in the connection details dialog box, click Filter.
The treemap data is updated based on the selected filter.
To see details for active connections to your Firebox, from Dimension:
- Select Home > Devices or Home > Groups.
The Devices or Groups page appears. - Select a device or group in the list.
If the Firebox or group has only a logging connection to Dimension, the Executive Dashboard page appears.
If the Firebox or group has a management connection to Dimension, the Device Summary page appears. - From the Start and End drop-down list calendars, select the start and end dates to include in the report data.
- On the Tools tab, select FireWatch.
The FireWatch page appears, with the Source tab selected by default. - Select a tab.
The current connections appear.
- To change the type of data that appears in the selected tab, from the drop-down list at the top right of the page, select an option:
- Bytes
- Connections
- To see details about any item in the treemap, place your cursor over the item.
The connection details dialog box appears.
Not all options are available for all connection types.
The data in the display is updated based on the option you selected.
- To see all connections for an item, in the connection details dialog box, click the IP address to view connections for.
Or, in the item on the main FireWatch tab, click View connections.
The connections dialog box appears. If the number of connections exceeds the limit, a warning message appears.
- To update the list of connections, click Refresh.
The connections list is updated with the most recent data. - To filter the information that appears in the treemap by a selected connection, in the connection details dialog box, click the IP address of the connection.
Or, in the item on the main FireWatch tab, click Filter.
The treemap data is updated based on the selected filter.
Delete a Connection
In Fireware Web UI, you can delete connections that appear in the FireWatch treemap.
- To delete a connection from the treemap, in the connection details dialog box, click Delete connections.
The Delete Connections dialog box appears.
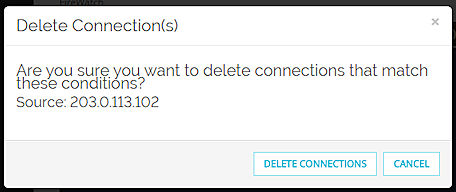
- Verify that the details in the Delete Connections dialog box are correct.
- In the Configuration Passphrase text box, type the configuration passphrase for the device.
- Click Delete connections.
All connection data for the specified connection is removed from the treemap.
Block a Site
In Fireware Web UI, from the Source or Destination tabs, you can temporarily add a connection that you have selected in the treemap to the Blocked Sites list. The selected connection remains on the Blocked Sites list for the amount of time that you specify.
For more information about the Blocked Sites list, see Blocked Sites.
To block a connection:
- In the connection details dialog box, click Block Site.
The Block Site dialog box appears for the selected connection.
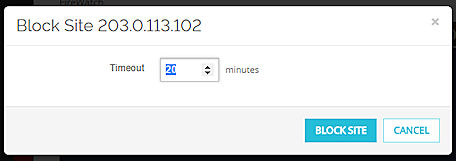
- In the Timeout text box, type the length of time to keep the selected connection on the Blocked Sites list.
- in the Configuration Passphrase text box, type the read-write passphrase for the device.
- Click Block Site.
Refresh FireWatch Data
In Fireware Web UI, by default, the data in the FireWatch treemaps refresh dynamically at the optimum rate for the data type on the selected tab. You can also manually refresh the data in the treemap.
To refresh the data in a treemap:
- Select a tab and a sort method for the data.
- Click
 .
.
The data in the treemap is updated and the display blocks refresh to display the new data.
View FireWatch in Full Screen Mode
When there are many active connections that appear in FireWatch, it can be helpful to see a larger view of the FireWatch screen. In Fireware Web UI and Dimension, you can use the Full Screen mode to expand your web browser view of FireWatch. In Dimension, when you change to Full Screen mode, the group selection tabs are removed and you cannot change the type of data (bytes or connections) that appears in the treemap.
Full Screen mode is available in the latest versions of most web browsers that support HTML5. You cannot use Full Screen mode in versions of Internet Explorer before v11. The Full Screen button is hidden for web browsers that do not support HTML5.
Full Screen mode options include:
- Select to include one or more groups in the display
- Specify the information refresh rate
- The settings controls are hidden after a period of time
- Select all standard filters
- See information in bytes for all groups except WebBlocker, which appears in number of connections
If byte counts are unavailable (such as for an older version of Fireware) information appears in number of connections.
To enable Full Screen mode:
- At the top of the FireWatch page, click
 .
.
The FireWatch page expands to full screen. If this is your first use of Full Screen mode, a confirmation message appears. - On the confirmation message, click Allow.
The confirmation message closes and FireWatch appears in Full Screen mode.
Full Screen mode in Dimension
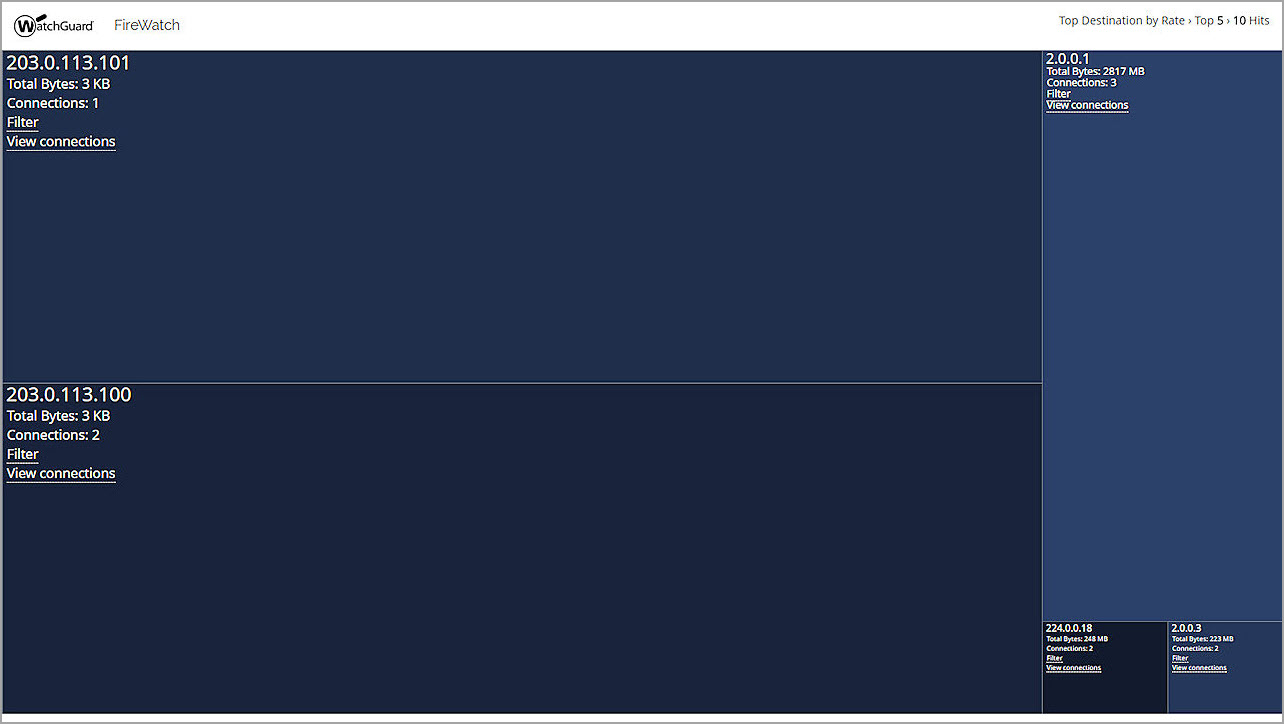
Full Screen mode in Fireware Web UI
- To change the group view, from the Select groups drop-down list, select the check box for each option to include in the Full Screen mode view:
- Source
- Destination
- Applications
- Domains (Dimension only)
- Web Audit (Dimension only)
- Protocol (Dimension only)
- Policies (Fireware Web UI only)
- Interface (In) (Fireware Web UI only)
- Interface (Out) (Fireware Web UI only)
- To specify the FireWatch page refresh rate, select an option:
- 5 seconds
- 10 seconds
- 15 seconds (Default)
- 30 seconds
- 60 seconds
- (Fireware Web UI only) To change the type of data that appears in FireWatch, from the second drop-down list, select an option:
- Rate
- Bytes
- Connection
- Duration
To disable Full Screen mode:
- Click
 .
. - Press Esc on your keyboard.