Applies To: Locally-managed Fireboxes
References to DNSWatch in this topic relate to the legacy DNSWatch UI. To learn about DNSWatch in WatchGuard Cloud, go to About DNSWatch in WatchGuard Cloud in WatchGuard Cloud Help.
After you enable DNSWatch on a Firebox, log in to DNSWatch to monitor and manage your DNSWatch account.
For information about how to log in, go to Log In to DNSWatch.
DNSWatch Dashboard
When you first log in to DNSWatch, the DNSWatch Dashboard appears. To return to the DNSWatch Dashboard from any other page, click the DNSWatch logo in the upper-left corner.
The DNSWatch Dashboard shows a summary of DNS traffic, top domains, top network, and monthly alerts.
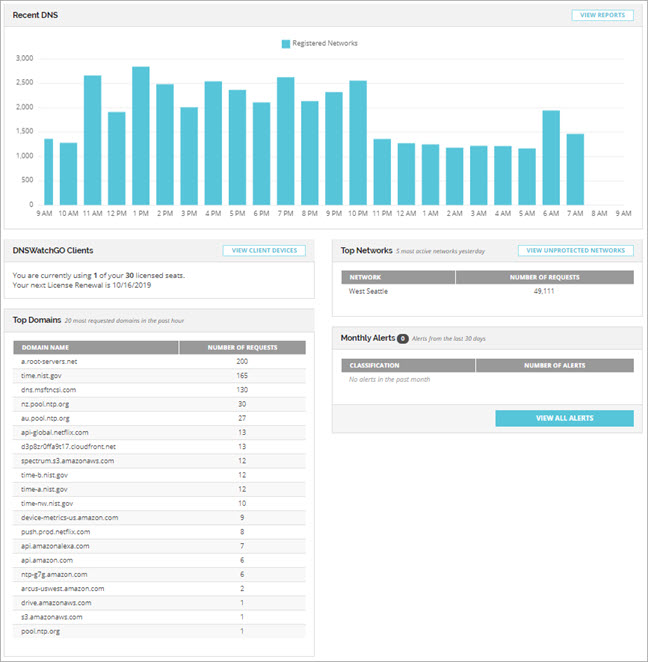
The DNSWatch Dashboard has four sections:
Recent DNS
The Recent DNS chart shows the number of DNS requests from protected, networks, Fireboxes, and DNSWatchGO
Clients to your DNSWatch account for the last 24 hours. To view weekly reports of DNS traffic, click View Reports. For more information, go to View DNSWatch Weekly Reports.
DNSWatchGO Clients
The DNSWatchGO Clients pane shows the number of DNSWatchGO licenses in use and the renewal date for the licenses. To view a list of the devices, click View Client Devices.
Top Domains
The Top Domains list shows the top 20 most requested domains in the past hour. To view weekly reports of the top 20 most requested domains, click View Reports in the DNS Traffic section, or select Reports > DNS Weekly Reports. For more information, go to View DNSWatch Weekly Reports.
Top Networks
The Top Networks list shows the five networks based on DNS requests in the past day. Click View Unprotected Networks to view a list of configured networks that have not sent traffic to DNSWatch recently.
Monthly Alerts
The Monthly Alerts section includes a summary of the number of monthly alerts for the past 30 days, by classification. To view a list of all alerts, click View All Alerts. For more information, go to Manage DNSWatch Alerts.
Manage DNSWatch Blocklist Domains