Applies To: Locally-managed Fireboxes
In Fireware v12.3 or higher, the Firebox can use performance metrics to make SD-WAN routing decisions. For example, you can configure an SD-WAN action that routes traffic over another interface if the primary interface becomes congested.
On the SD-WAN tab in Firebox System Manager, you can:
- Configure graphs that show real-time performance metrics for external interfaces (Fireware v12.2.1 or higher)
- Configure graphs that show real-time performance metrics for internal interfaces (Trusted, Optional, and Custom), and BOVPN virtual interfaces (Fireware v12.4 or higher)
- Select to manually fail back connections for SD-WAN actions (Fireware v12.3 or higher)
- See a list of all SD-WAN actions configured on the Firebox and the mode, interfaces, and failback options for each action (Fireware v12.3 or higher)
For more information about SD-WAN actions and policies, go to About SD-WAN.
To monitor an interface, you configure one or more Link Monitor targets for the interface. For more information about Link Monitor, go to About Link Monitor.
This topic explains monitoring, status, and manual failback in Firebox System Manager (FSM). For monitoring, status, and manual failback information for Fireware Web UI, go toInterface Information and SD-WAN Monitoring and SD-WAN Status and Manual Failback (Web UI).
About SD-WAN Monitoring
You can select one of these metrics to appear on the SD-WAN graph:
- Loss — Percentage of packets lost
- Latency — Packet delivery delay, measured in milliseconds (ms)
- Jitter — Variance in packet delivery delay, measured in milliseconds (ms)
The Firebox uses the Link Monitor targets you specify for an interface to calculate loss, latency, and jitter. For example, if you specify 203.0.113.1 as a Link Monitor target for the interface eth0, the SD-WAN graph shows loss, latency, and jitter for communication between the eth0 interface and 203.0.113.1.
To calculate loss, latency, and jitter, the Firebox uses the 100 most recent probe results from link monitor targets. Probe results are stored in groups of 10. When 10 groups are each filled with 10 probe results, probe results in the oldest group are cleared, and 10 new results are stored.
To calculate jitter, the uncorrected standard deviation is used. For detailed information about how jitter is calculated, see How is jitter calculated? in the WatchGuard Knowledge Base.
In Fireware v12.2.1, the Firebox uses the 10 most recent probe results from Link Monitor targets, and the corrected standard deviation is used to calculate jitter.
Configure SD-WAN Monitoring
To see SD-WAN monitoring data for an interface:
- Link Monitor must be enabled for the interface.
To see meaningful data for external interfaces, we recommend that you specify a Link Monitor target other than the default gateway. - In the graph settings, you must add the interface.
To see SD-WAN monitoring data for FireCluster members:
- For an active/passive cluster, connect to the management IP address of the cluster master, or connect to an interface IP address. SD-WAN monitoring data is not available on a passive cluster member.
- For an active/active cluster, you must connect to the management IP address of the cluster master. SD-WAN data is not available on a passive cluster member or if you connect to an interface IP address.
After you configure a Link Monitor target and add an interface in the graph settings, you can configure other graph settings. These settings control:
- Which metric appears on the graph (loss, latency, or jitter)
- Which interfaces appear on the graph
The graph can show data from multiple Firebox interfaces. - The text color of the interface
- The background and grid line colors of the graph
- Data refresh interval (5, 10, 30, or 60 seconds; 2 or 5 minutes)
- Graph scale (auto or custom)
In Firebox System Manager, only one graph at a time appears on the SD-WAN tab. To see graphs for loss, latency, and jitter on one page, you must use Fireware Web UI.
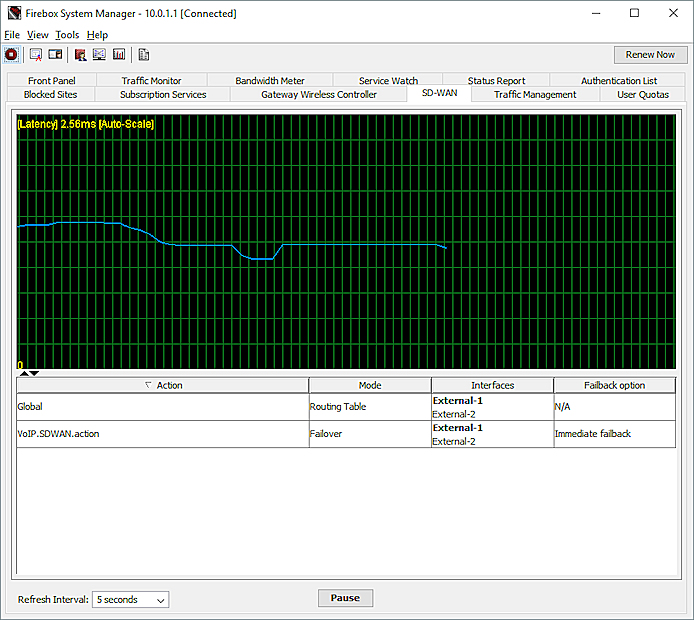
- Open Firebox System Manager.
- Click the SD-WAN tab.
The SD-WAN graph appears.
- Right-click the graph.
The settings menu appears.
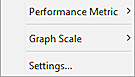
- Select Performance Metric.
- Select Loss, Latency, or Jitter.
The graph updates to show information for the selected metric. - Right-click the graph.
- Select Settings.
The Settings dialog box appears. - In the Hide column, select an interface. To select more than one interface, press and hold the Shift or Ctrl key on your keyboard and then click the interfaces.
- To add the selected interfaces to the Show column, click Add.
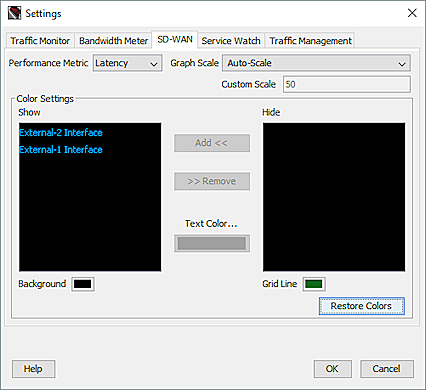
- Click OK.
The graph begins to shows data for the measure you specified.
Configure the Refresh Options
Firebox System Manager shows real-time data for the last five minutes only. To see historical data for the last 7 days, you must use the Web UI.
To configure how often Firebox System Manager contacts the Firebox for data:
- Select Refresh Interval.
- Select 5 seconds, 10 seconds, 30 seconds, 60 seconds, 2 minutes, or 5 minutes.
Pause Data Collection
You can click Pause to stop data collection and click Continue to restart data collection.
Change the Graph Scale
To change the graph scale:
- Right-click the graph and select Graph Scale.
- Select Auto-Scale or Custom Scale.
- If you selected Custom Scale, right-click the graph and select Settings.
- In the Custom Scale text box, type a value between 5 and 100000.
The default Custom Scale setting is 50.
Interpret SD-WAN Monitoring Data
Before you use SD-WAN monitoring data to make decisions about your network, we recommend that you establish baseline values that are specific to your network. To do this, look at the average loss, latency, and jitter values calculated for an extended span of time. As a best practice, we recommend that you consider the average values for the last 24 hours. Because Firebox System Manger shows only real-time data, to see values for a longer time period you must use the Web UI, which shows historical data for spans of time up to 7 days and calculates an average.
For information about how to interpret SD-WAN monitoring data in the Web UI, go to Interpret SD-WAN Monitoring Data.
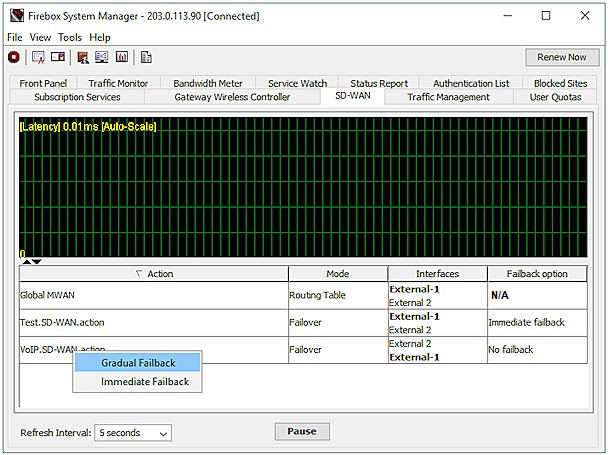
About SD-WAN Status and Failback
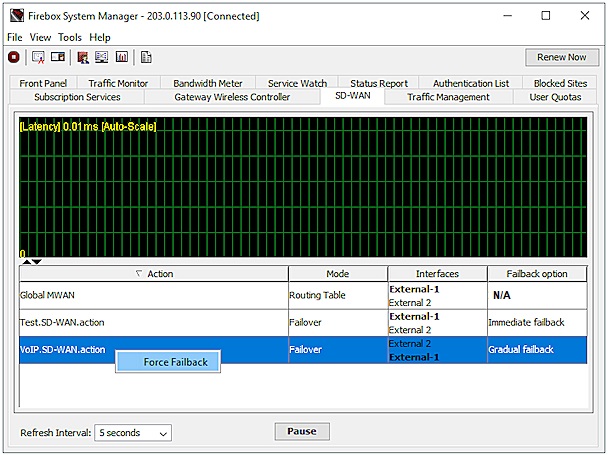
On the SD-WAN tab in Fireware v12.3 or higher, you can select to manually fail back connections for SD-WAN actions. You can also view a list of all SD-WAN actions configured on the Firebox and the mode, interfaces, and failback options for each action.
SD-WAN actions in this list include:
- Global action — Automatically generated if more than one external interface is configured on the Firebox
- Other SD-WAN actions — Manually added in Policy Manager on the Network > Configuration > SD-WAN page
SD-WAN Actions List
In the list of SD-WAN actions, this information appears for each action:
Mode
For the Global action, the mode indicates the routing method specified in the multi-WAN configuration: Routing Table, Round Robin, Failover, or Interface Overflow.
For SD-WAN actions you manually added, the mode is Failover.
Interfaces
All interfaces that participate in the SD-WAN action appear. The interface name with bold text is the primary interface.
To change the primary interface:
- For SD-WAN actions that you manually added, in the SD-WAN configuration, move the interface up or down in the list.
- For the Global action, in the multi-WAN configuration, move the interface up or down in the list. You can only change the primary interface if Failover or Interface Overflow is selected as the multi-WAN routing method.
Failback Option
The failback option specifies how active and new connections fail back to the primary interface: gradually, immediately, or never.
For SD-WAN actions that you manually added, you configure the failback option in the SD-WAN action configuration.
For the Global action, the failback option is determined by the routing method selected in the multi-WAN configuration. If the multi-WAN method is Failover, the failback option on the SD-WAN Status page is Immediate failback. If the multi-WAN method is Routing Table, Round Robin, or Interface Overflow, the failback option on the SD-WAN Status page does not apply and should appear as N/A.
In the SD-WAN action configuration, you can configure these options:
- Immediate failback — Active and new connections use the failback (original) interface.
- Gradual failback — Active connections continue to use the failover interface; new connections use the failback (original) interface.
- No failback — Active and new connections continue to use the failover interface. You might select this option if you want to confirm the issue that caused the failover is resolved before you fail back to the original WAN connection.
If you select Gradual Failback or No Failback in the SD-WAN action, you can initiate manual failback on the SD-WAN Status page. This procedure is described in the next section.
Initiate Manual Failback
For interfaces that participate in an SD-WAN action, you can manually force connections to fail back .
In the SD-WAN action configuration, if the failback setting is Gradual Failback:
- On the SD-WAN tab in FSM, you can select the Force Failback option.
- The Force Failback option terminates active connections and forces new connections to use the failback (original) interface.
In the SD-WAN action configuration, if the failback setting is No Failback:
- On the SD-WAN tab in FSM, you can select Gradual Failback or Immediate Failback.
- The Gradual Failback option keeps active connections on the failover interface and forces new connections to use the failback (original) interface.
- The Immediate Failback option terminates active connections and forces new connections to use the failback interface.