Applies To: WatchGuard CloudDR
On the Threats > Activity page, you can review the events that occur in your cloud environment. You can filter the page to show events for a date range.
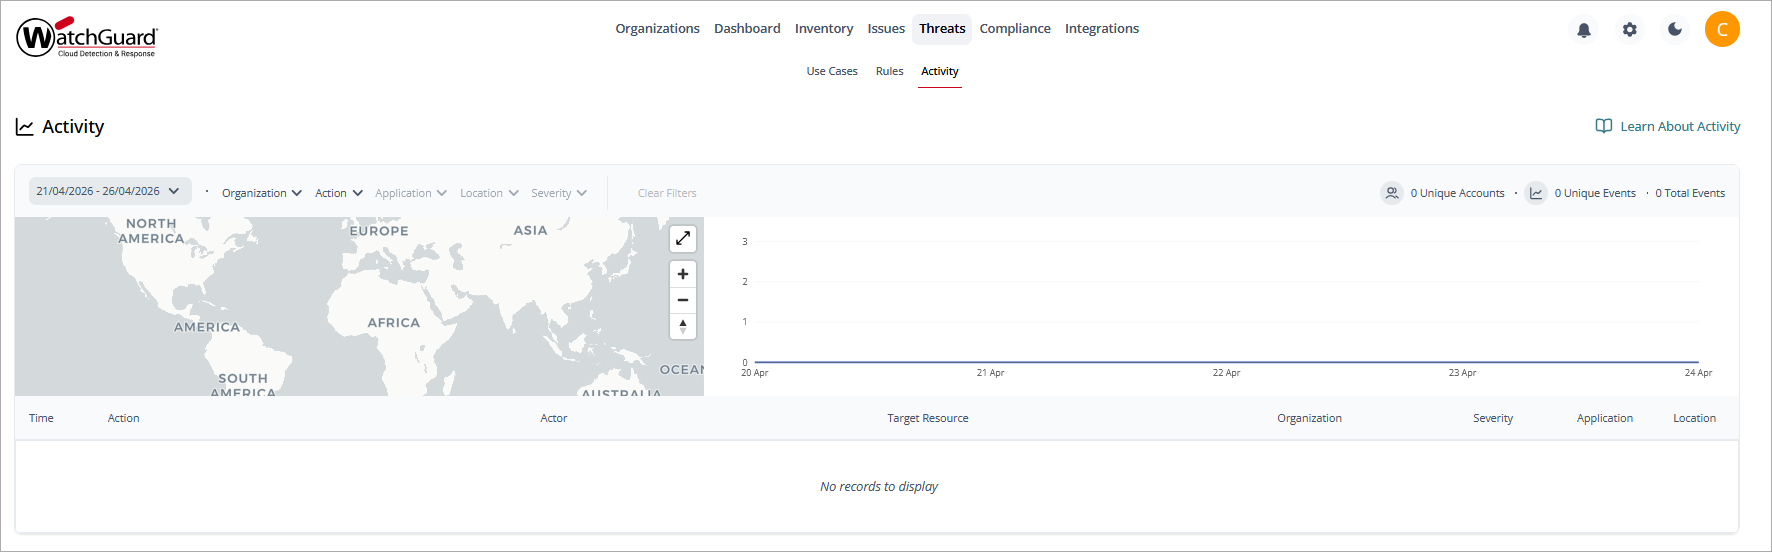
You can also filter the page by Organization, Action, Application, Location, and Severity.
In the upper-left corner of the page, you can see a visual representation of the events and where they occurred. This map can help you gauge normal activity for your organization and spot any abnormal highs or lows quickly. Point to a circle on the map to see the latitude and longitude of the location. Use the + and - to zoom in and out of the map. Drag the map to rotate it. Click the up arrow to return the map to north at the top of the map.
In the upper-right corner of the page, you can see the events over a period of time. Point to a date to show the events that occurred that day.
The bottom of the page includes a list of the events. Information in this list includes:
- Time
- Action
- Actor
- Target Resource
- Organization
- Severity
- Application
- Location
Event Details Page
To view granular details for a specific event, select an event from the list.
The upper area of the event details page provides a summary of the event, including:
- Action Time
- Category
- Target Resource
- Application
- Actor
- Location
More detailed information is available on the Action Details and Raw Log pages. To open the page, click the tab.
Action Details
On the Action Details page, you can see geographic information of the event location and more event details, including:
- Application
- Type
- Client ID
- Scopes
- User Email
- Profile ID
Raw Logs Page
On the Raw Logs page, you can review the raw log entry that was generated by the event.
To copy the code to your clipboard, click ![]() .
.