Applies To: Cloud-managed Fireboxes, Locally-managed Fireboxes
Policy Map is an interactive report tool that aggregates the allowed traffic through your Fireboxes and shows that allowed traffic in a visualization of the traffic flows. Each traffic flow is defined by the unique path a connection takes through the device as it is processed by policies, services, and configuration settings. Each path is represented by a traffic flow ribbon. The thickness of a traffic flow ribbon indicates how much traffic is included in that traffic flow: thicker ribbons have more bytes or connections. The color of the ribbons and nodes indicate the type and disposition of the traffic:
- Interfaces — Blue
- Policies — Orange
- Disposition — Green (Allow), Red (Deny)
- Applications and Application categories — Purple
- Web Audit categories — Purple
- Subscription Services — Yellow
- Viruses, DLP rules, APT Blocker — Yellow
Policy Map includes many options to filter and pivot on the data in the traffic flows, and to further explore the details of the traffic flows. You can view information for the selected device in Policy Map for the date and time range you select.
From Policy Map, you can view:
- Subscription Services activity
- Application activity through policies
- Policies in use
- Policies that use the most bandwidth
- Interfaces in use
- Connections between active interfaces
The Policy Map diagrams show visualizations of multiple key concepts at the same time:
- Links between nodes show how the data flows
- Size of links and nodes show the number of bytes or connections
- Color of links show the disposition of the connections (Allowed or Denied)
You can also view more detailed information about the data in the Policy Map in tooltips and pop-up dialog boxes.
If this dashboard is not available for your device, follow the steps to Enable Logging for this Dashboard.
About Policy Map Types
From the Policy Map page, you can select one of the Policy Map types to specify the information that is included in the traffic flow. Each map type includes different data nodes. For each map type, you can pivot the data to further refine the details included in the Policy Map. Pivot options are only available if the log messages from your device include data for that pivot option.
| Map Types |
Column Node Descriptions |
Pivots |
|---|---|---|
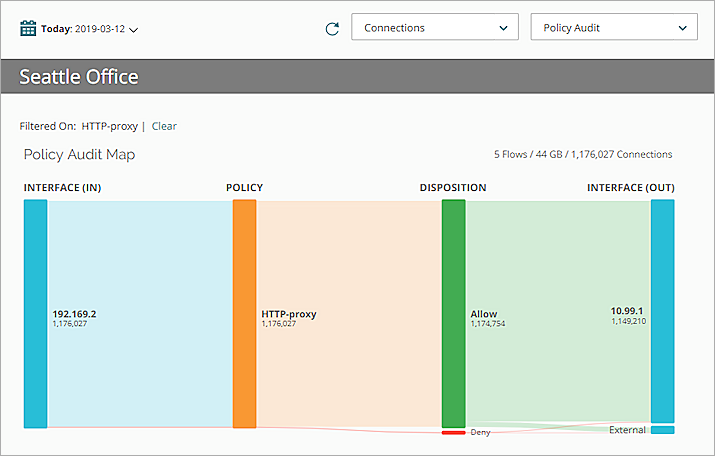
| Policy Audit |
Default Policy Map type Includes all connections aggregated by Source Interface, Firewall Policy, Disposition, and Destination Interface |
Bytes, Connections |
| Subscription Services | Includes all connections for the Subscription Services enabled on your devices or groups, aggregated by Source Interface, Firewall Policy, Subscription Service, Disposition, and Destination Interface | Bytes, Connections |
| Web Audit | Includes connections that are aggregated by Source Interface, Firewall Policy, WebBlocker Category, and Disposition | Connections |
| Application Control | Includes connections that are aggregated by Source Interface, Firewall Policy, Application Category, Disposition, and Destination Interface | Bytes, Connections |
| Intrusions (IPS) | Includes connections that are aggregated by Source Interface, Firewall Policy, Severity Level, Disposition, and Destination Interface | Connections |
| Advanced Malware (APT) | Includes connections that are aggregated by Source Interface, Firewall Policy, Threat Level, Disposition, and Destination Interface | Connections |
| Data Loss Violations (DLP) | Includes connections that are aggregated by Source Interface, Firewall Policy, Rule Name, Disposition, and Destination Interface | Connections |
| Virus (GAV) | Includes connections that are aggregated by Source Interface, Protocol, Virus Name, Disposition, and Firewall Policy | Connections |
View Traffic Flows in WatchGuard Cloud
To view the traffic flows on your device, in WatchGuard Cloud:
- Log in to WatchGuard Cloud.
- Select Monitor > Devices.
- Select a folder or a specific device.
- To select the report date range, click
 .
.
- From the list of reports, select Dashboards > Policy Map.
The Policy Map page opens, with the Policy Audit map type selected by default.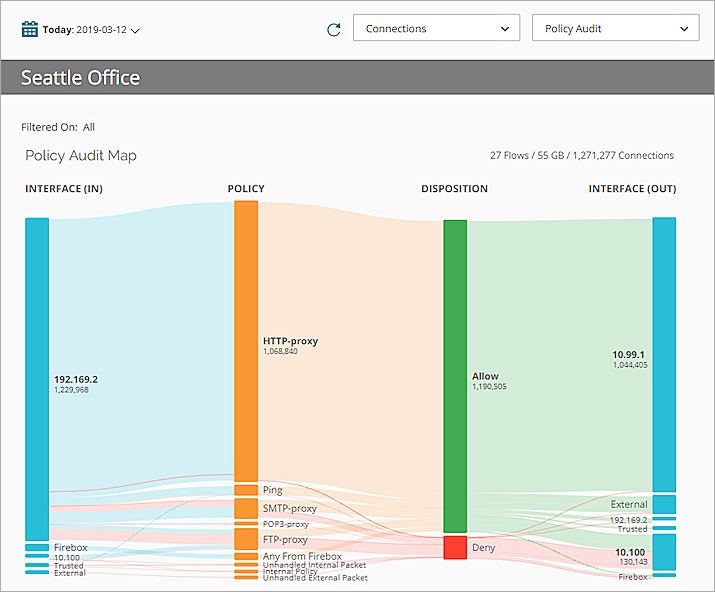
- To show data for a specific time period:
- Above the Policy Map, click the currently selected time period.
A drop-down list opens. - Select a predefined period from the list or select Custom and specify a custom time period. For more information, go to Filter Reports and Dashboards by Date.
Data shows for the time range you specified.
- Above the Policy Map, click the currently selected time period.
- To change the information in the map, from the map type drop-down list at the top-right of the page, select an option:
- Policy Audit
- Subscription Services
- Web Audit
- Application Control
- Intrusions (IPS)
- Advanced Malware (APT)
- Data Loss Violations (DLP)
- Virus (GAV)
- To change the type of data that shows in the page, from the drop-down list at the top of the page, select a pivot option:
- Bytes
- Connections
- Review the information in the Policy Map.
For more information about how to use the interactive features in Policy Map, go to the next section.
About the Internal-Policy Traffic Flow
When you review traffic flows in Policy Map, the Internal-Policy traffic flow might appear. Unlike the other traffic flows in Policy Map, this traffic flow does not show connections through one policy (or protocol). Instead, the Internal-Policy traffic flow includes this traffic:
- IPSec traffic that uses the ESP or AH protocol
- Any traffic to or from a cluster interface in a FireCluster
- Traffic through a GRE tunnel from localhost to an IPSec tunnel
- UDP traffic from localhost port 68 to destination port 67 (DHCP)
- UDP traffic from destination port 67 to localhost port 68 (DHCP)
- Traffic to or from an interface with the GRE protocol
Though the Internal-Policy traffic flow shows in Policy Map when traffic through the device meets these conditions, Internal-Policy does not show in the list of policies for your device in Policy Manager or the Fireware Web UI.
If the settings change for any of the items that appear in the Internal-Policy traffic flow, the appearance of the traffic flow also changes. For example, if you disable an IPSec tunnel on your device, traffic and protocols for that IPSec traffic are no longer included in the Internal-Policy traffic flow.
Use Policy Map Interactive Features
After you have selected the map type and pivot options for a Policy Map, you can use the interactive features in Policy Map to view the details about the flow of traffic through your device. Each Policy Map includes a data flow for each policy that is in use and a column for each node included in the traffic flow. The columns (nodes) included in each Policy Map depend on the map type you select.
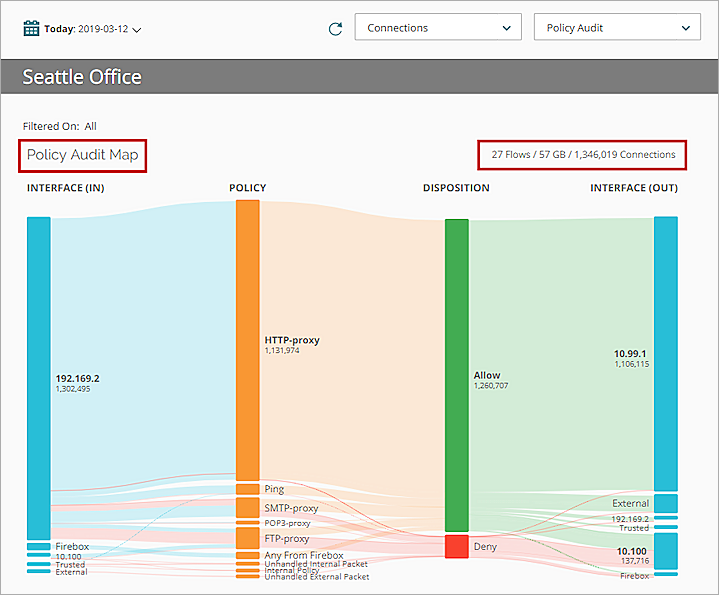
View Policy Map Information
At the top of the Policy Map page, the map type, the number of flows, bytes, and connections that are included in the map type you selected appear.
Each link ribbon between columns shows how the data flows through each column. The size of each ribbon and column indicate the number of bytes or connections for that node. The disposition of the connections (Allowed or Denied) is indicated by the color of the ribbon or column.
View the Traffic Flow
To view the flow of traffic through the policies defined on your Firebox, FireCluster, or group, place your mouse cursor over a link ribbon in Policy Map.
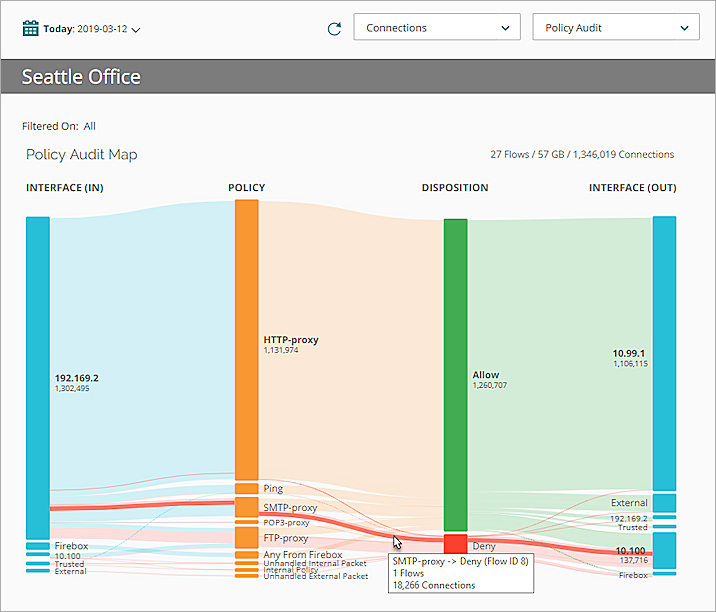
The flow of the traffic is highlighted in the map and a pop-up dialog box opens, with these details:
- The Flow ID number
- The number of flows for the selected traffic
- The number of connections for the traffic flow
View the Traffic Flow Details
- To view details about the nodes in each traffic flow, place your mouse cursor over each column that the ribbon flows through.
A tooltip opens. - To view more information about a particular node, click the node.
A dialog box opens.
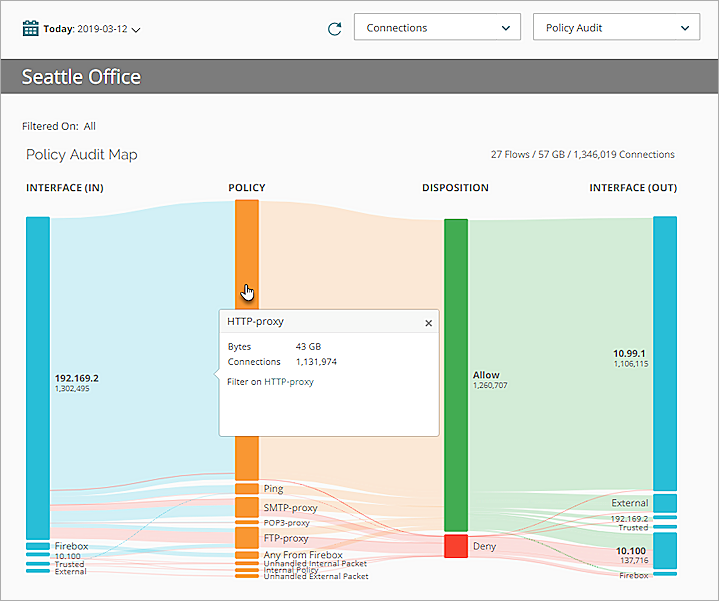
The dialog box that opens includes:
- The number of connections through the selected node for the selected traffic flow.
- Some nodes also include the number of bytes sent through the traffic flow.
- An option to filter Policy Map on the selected node in the traffic flow.
Filter Policy Map
To view only the information from a selected node in a policy flow, you can filter Policy Map on that node in the traffic flow.
In the dialog box, next to Filter on, click the blue link text.
The Policy Map filters the selected traffic flow.
To clear the filters, next to Filtered On, click Clear.
The Policy Map page opens for the map type you selected.
Enable Logging for this Dashboard
Logging for cloud-managed Fireboxes is automatically enabled. For locally-managed Fireboxes, you must manually enable logging in Fireware Web UI or Policy Manager. For more information, go to Set Logging and Notification Preferences.
To collect the data required for this report for locally-managed Fireboxes, in Fireware Web UI or Policy Manager:
- In the Logging and Notification settings for all packet filters, select Send a log message for reports. For more information, go to Set Logging and Notification Preferences.
- In the General Settings for all proxy actions, select Enable logging for reports.
- In all APT Blocker actions, select the Log check boxes for threat levels. For more information, go to Configure APT Blocker.
- In all DLP Sensor actions, select the Log check box. For more information, go to Configure DLP Sensors.
- In the Gateway AntiVirus settings for a proxy action, select the Log check boxes for all Gateway AntiVirus actions. For more information, go to Configure Gateway AntiVirus Actions.
- In the Intrusion Prevention settings, select the Log check box for threat levels with the Block and Drop actions. For more information, go to Configure Intrusion Prevention.
- In all WebBlocker actions, select the Log check box for all categories and select the When a URL is uncategorized, Log this action check box. For more information, go to Configure WebBlocker Categories.