Applies To: Cloud-managed Fireboxes, Locally-managed Fireboxes
In the WatchGuard Cloud Device Summary page, you can see a summary of status for all devices, and the detailed status for each device. On the Device Summary page, you can generate an Executive Summary report for a device or devices.
The Executive Summary report is a PDF report that includes a high-level summary of the attacks and traffic blocked by the Firebox. There are three sections in the report:
- Malware Attacks
- Network Attacks
- Top Categories
The data in the report might be presented in billions (B), millions (M), or thousands (K).
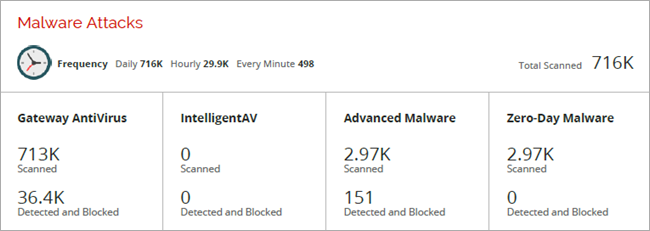
Malware Attacks
This section of the report shows the frequency of malware attacks, as well as the number of files scanned and blocked by these services:
- Gateway AntiVirus
- IntelligentAV
- Advanced Malware (APT Blocker)
- Zero-day Malware (APT Blocker)
Network Attacks
This section shows the frequency of network attacks, the number of files scanned, and the number of attacks prevented, detected, and blocked by these services:
- Intrusion Prevention Service
- Geolocation
- Reputation Enabled Defense
- Botnet Detection
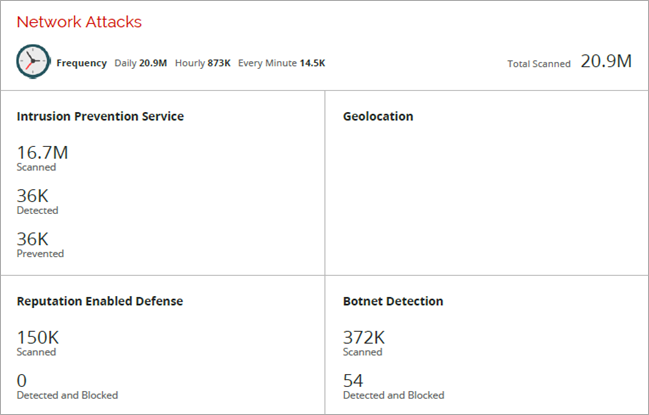
Data appears in each of these categories only when there is data available in the category for the selected date range.
Top Categories
This section of the report highlights the number of bytes or hits recorded by the top entry in each category.
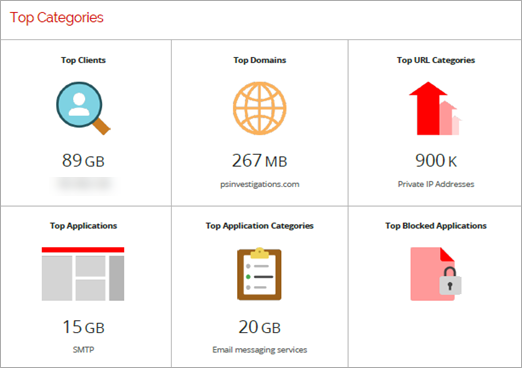
Below the table, you can also see a list of the top five entries in each of these categories:
- Clients
- Domains
- URL Categories
- Applications
- Application Categories
- Blocked Applications
Generate the Executive Summary Report
To generate the Executive Summary report:
- Log in to WatchGuard Cloud.
- Select Monitor > Devices.
- Select a folder or a specific device.
- Select Device Summary.
- To select the report date range:
- Above the dashboard, click
 .
.
A drop-down list opens. - Select a predefined period from the list or select Custom and specify a custom time period. For more information, see Filter Reports and Dashboards by Date.
The data in the Device Summary changes based on the time range you specify.
- Above the dashboard, click
- Click the PDF icon
 in the upper, right corner.
The file downloads or a confirmation message opens. - If the report does not download automatically, select to open or save the file.
Enable Logging for this Dashboard
Logging for cloud-managed Fireboxes is automatically enabled. For locally-managed Fireboxes, you must manually enable logging in Fireware Web UI or Policy Manager. For more information, see Set Logging and Notification Preferences.
To collect the data required for this report for locally-managed Fireboxes, in Fireware Web UI or Policy Manager:
- In the Logging and Notification settings for all packet filter policies, select Send a log message for reports. For more information, see Set Logging and Notification Preferences.
- In the General Settings for all proxy actions, select Enable logging for reports.