Applies To: Cloud-managed Fireboxes
Information on the Traffic Shaping page can help you monitor network performance and bandwidth. You can view bandwidth statistics for the traffic that you manage with traffic shaping rules and review the policies and applications that use each rule. You can also view bandwidth statistics, current bandwidth, and usage as a percentage of the configured maximum bandwidth for a traffic shaping rule.
This page is available only when you connect a cloud-managed Firebox to WatchGuard Cloud. You cannot use traffic shaping to monitor a locally-managed Firebox.
In WatchGuard Cloud, you can monitor traffic shaping for:
- Guaranteed bandwidth for each user
- Guaranteed bandwidth for all users
- Limited bandwidth for each user
- Limited bandwidth for all users
Cloud monitoring is not available for QoS markings, nor are there any log messages. If you want to verify a QoS marking on your network, you can analyze traffic packets on your network for the hexadecimal value of the QoS marking. For more information, go to Run Network Diagnostic Tasks in WatchGuard Cloud.
Monitor Traffic Shaping Information
In Traffic Management statistics, 1 Kbps is equal to 1024 bits a second.
To monitor traffic shaping information for cloud-managed Fireboxes:
- Select Monitor > Devices.
- Select a Firebox.
The Device Summary page for the selected Firebox opens. - Select Live Status > Traffic Shaping.
The Traffic Shaping page opens.
To open live status in a new window, click  in the upper, right corner of the WatchGuard Cloud window.
Real-time Policy Traffic
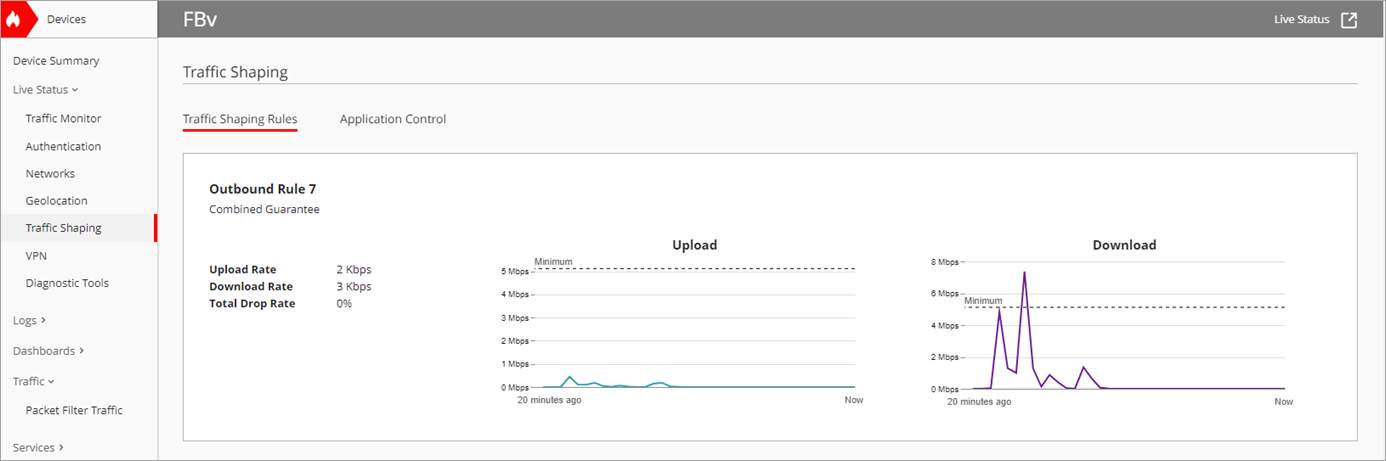
On the Traffic Shaping Rules tab, you can view real-time data on the currently active traffic shaping rules on the Firebox. The tab shows data for traffic shaping rules for policies. The tiles refresh every 30 seconds and show activity for the previous 20 minutes.
If you leave the Traffic Shaping page, the 20-minute timeline restarts.
On the Traffic Shaping Rules page, you can view this real-time data:
Total Users
Number of users who currently share the bandwidth allocated in the rule.
Upload Usage
Percentage of the upload bandwidth limit that is currently in use. It is the Rate divided by the Maximum bandwidth.
Upload Rate
Current download rate for the traffic handled by each rule.
Download Rate
Current download rate for the traffic handled by each rule.
Download Usage
Percentage of the of the download bandwidth limit that is currently in use. It is the Rate divided by the Maximum bandwidth.
Total Drop Rate
Historical drop rate for packets handled by each rule. The drop rate statistic is an average percentage of packets dropped for all traffic handled by the traffic shaping rule from when you create or last modify it, or from the last time the device rebooted.
Real-time Policy Traffic for an Individual Rule
For more information about a traffic shaping rule, click the tile.
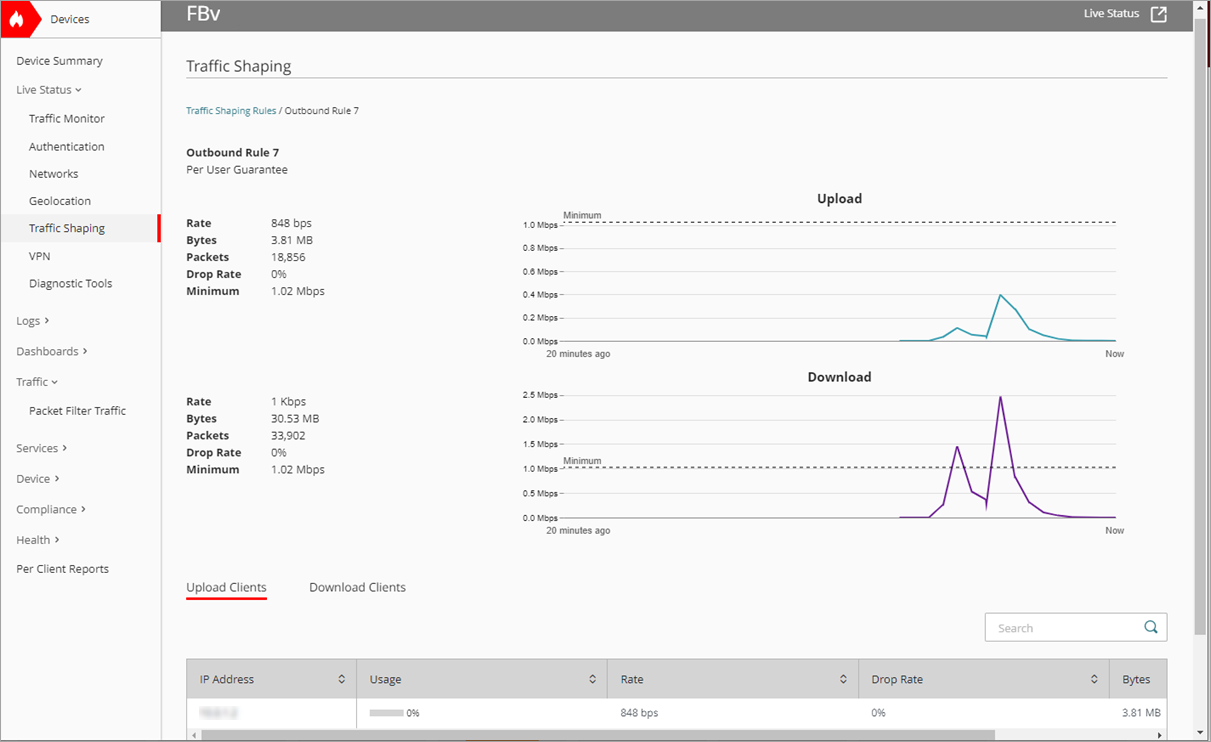
The information available for an individual rule includes:
Usage
Percentage of the bandwidth limit is currently in use. It is the Rate divided by the Maximum bandwidth.
Rate
Current data rate for the traffic handled by each rule.
Bytes
Current number of bytes for traffic handled by each rule.
Packets
Total number of packets.
Drop Rate
Historical drop rate for packets handled by each rule. The drop rate statistic is an average percentage of packets dropped for all traffic handled by the traffic shaping rule from when it was created or last modified, or from the last time the device rebooted.
Minimum and Maximum
The Guarantee Bandwidth and Limit Bandwidth values configured in the traffic shaping rule.
Real-time Application Control Traffic
On the Application Control tab, you can view real-time data on the currently active connections through your Firebox. The tab shows data for traffic shaping rules that use content filtering. The tiles refresh every 30 seconds and show activity for the most recent 20 minutes.
If you leave the Traffic Shaping page, the 20-minute timeline restarts.
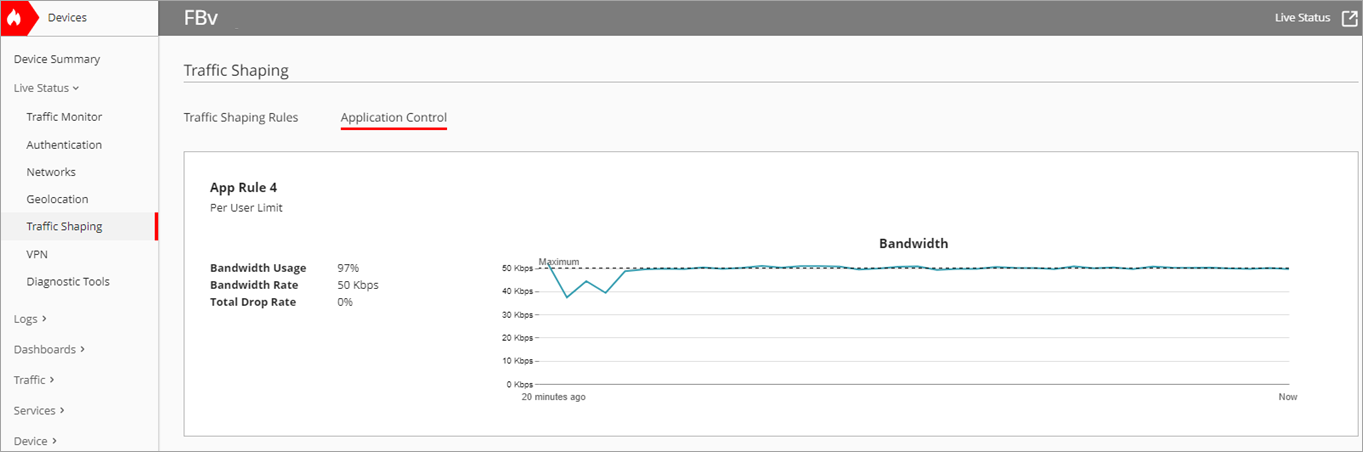
On the Application Control tab, you can view this real-time data:
Bandwidth Usage
Percentage of the bandwidth limit that is currently in use. It is the Rate divided by the Maximum bandwidth.
Bandwidth Rate
Percentage of the current bandwidth rate for the traffic handled by each rule.
Total Drop Rate
Historical drop rate for packets handled by each rule. The drop rate statistic is an average percentage of packets dropped for all traffic handled by the traffic shaping rule from when you create or last modify it, or from the last time the device rebooted.
For more information about the traffic shaping rule data, click the tile.
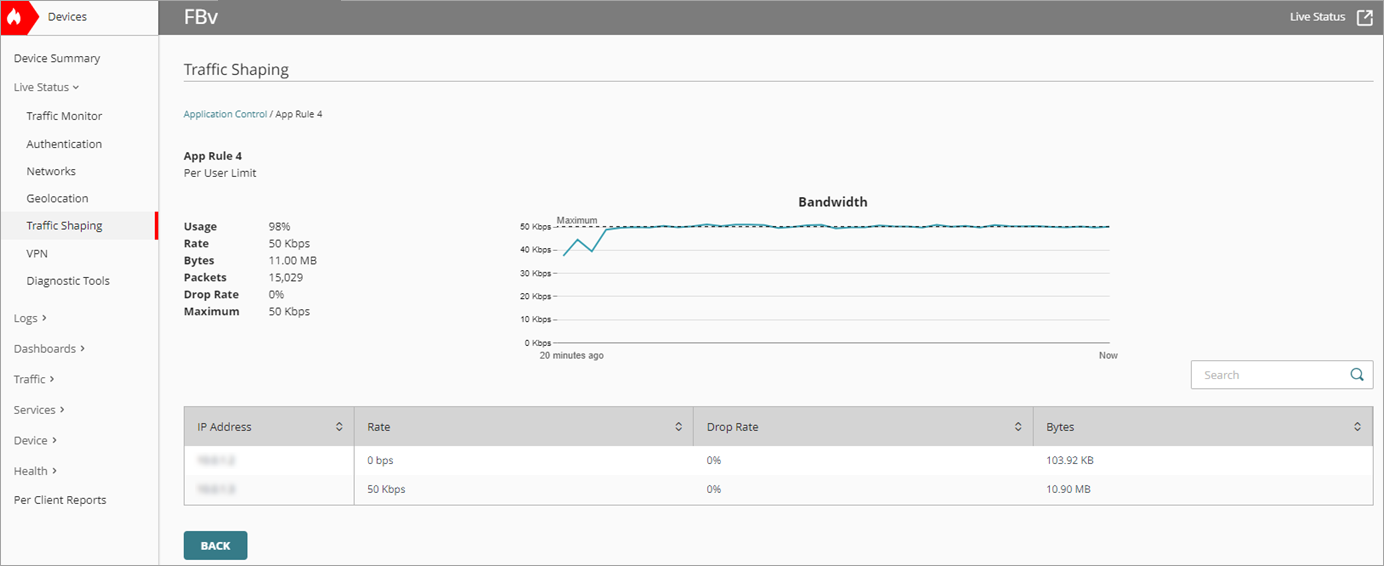
Real-time Application Control Traffic for an Individual Rule
The information available for an individual traffic shaping rule for Application Control includes:
Usage
Percentage of the bandwidth limit currently in use. It is the Rate divided by the Maximum bandwidth.
Rate
Current data rate for the traffic handled by each rule.
Bytes
Current number of bytes for traffic handled by each rule.
Packets
Total number of packets.
Drop Rate
Historical drop rate for packets handled by each rule. The drop rate statistic is an average percentage of packets dropped for all traffic handled by the traffic shaping rule from when you create or last modify it, or from the last time the device rebooted.
Minimum and Maximum
The Guarantee Bandwidth and Limit Bandwidth values configured in the traffic shaping rule.