Applies To: Cloud-managed Fireboxes, Locally-managed Fireboxes
This document applies to Fireboxes you manage in WatchGuard Cloud. For information that applies to Fireboxes managed in Fireware Web UI or WatchGuard System Manager, go to:
Overview
You can run these diagnostic tools in WatchGuard Cloud to test and troubleshoot network connectivity from the Firebox:
- Ping IPv4 — Send test packets to an IPv4 address or host name.
- Ping IPv6 — Send test packets to an IPv6 address or host name.
- TCP Dump — View information about packets transmitted across your network and save the results to a file.
- DNS Lookup — Perform a DNS query to find the IP address a host name resolves to.
- Traceroute — Identify the path that packets take from your device to a specified IPv4 or IPv6 address or host name, and show each hop along the path.
You can also download a diagnostic snapshot file of the Firebox log data and system information. For more information, go to Download Diagnostic Snapshot File.
To run these tools in the local Fireware Web UI for a cloud-managed Firebox, go to Run Network Diagnostic Tasks in Fireware Web UI.
Command Arguments
Some of the diagnostic tools available in WatchGuard Cloud accept additional inputs called command arguments. Sometimes referred to as options, flags, or switches, arguments enable you to control the diagnostic task behavior. For example, you can specify interfaces, set numeric values, or adjust protocol-specific settings. When you combine multiple arguments, you can refine your results and troubleshoot specific network issues more efficiently.
Use Diagnostic Tools
This section explains how to run built‑in troubleshooting utilities—such as Ping, TCP Dump, DNS Lookup, and Traceroute—from WatchGuard Cloud to test connectivity and analyze network behavior.
Use Ping IPv4
To ping an IPv4 host:
- Select Monitor > Devices.
- Select a Firebox.
- From the Devices menu, select Live Status > Diagnostic Tools.
The Diagnostic Tools page opens. - From the Task drop-down list, select Ping IPv4.
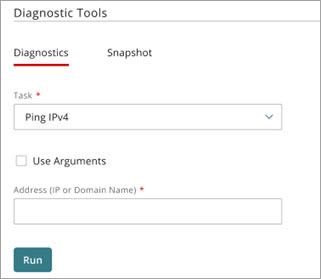
- (Optional) To narrow the results, use arguments:
- Select Use Arguments.
The Arguments text box opens. - In the Arguments text box, type one or more Ping IPv4 arguments.
For example, use -c 5 to send five echo requests, -i 2 to set a two second interval, or -s 128 to specify a 128‑byte packet size. Arguments are case-sensitive. For more information about Ping IPv4 arguments, go to Ping IPv4 Command Arguments.
- Select Use Arguments.
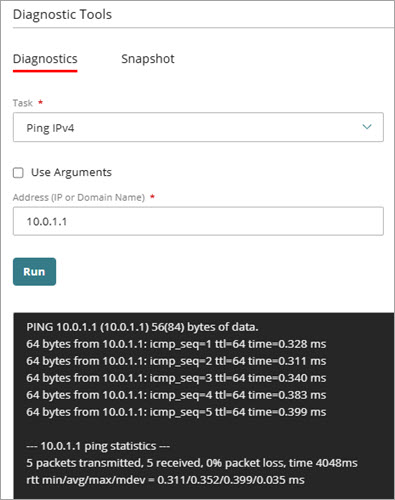
- In the Address text box, type an IP address or domain name to ping. For example, enter 192.168.1.1 or example.com.
- Click Run.
Ping results appear.
Use Ping IPv6
To ping an IPv6 host:
- Select Monitor > Devices.
- Select a Firebox.
- From the Devices menu, select Live Status > Diagnostic Tools.
The Diagnostic Tools page opens. - From the Task drop-down list, select Ping IPv6.
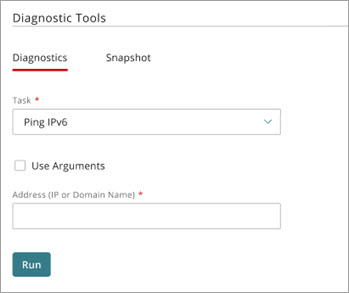
- (Optional) To narrow the results, use arguments:
- Select Use Arguments.
The Arguments text box opens. - In the Arguments text box, type one or more Ping IPv6 arguments.
For example, use -c 5 to send five echo requests, -i 2 to set a two second interval, or -s 128 to specify a 128‑byte packet size. Arguments are case-sensitive. For more information about Ping IPv6 arguments, go to Ping IPv6 Command Arguments.
- Select Use Arguments.
- In the Address text box, type an IP address or domain name to ping. For example, enter 2001:db8::1 or example.com.
- Click Run.
Ping IPv6 results appear.
Use TCP Dump
To run TCP Dump:
- Select Monitor > Devices.
- Select a Firebox.
- From the Devices menu, select Live Status > Diagnostic Tools.
The Diagnostic Tools page opens. - From the Task drop-down list, select TCP Dump.
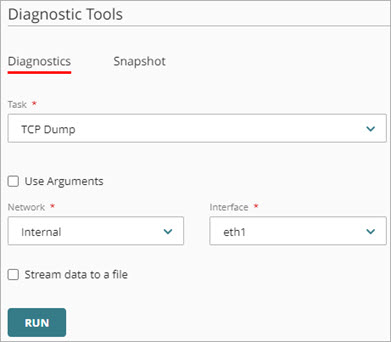
- (Optional) To narrow the results, use arguments:
- Select Use Arguments.
The Arguments text box opens. - In the Arguments text box, type one or more TCP Dump arguments.
For example, to capture data for the default external interface, type -ieth0 or -i eth0. Arguments are case-sensitive. For more information about TCP Dump arguments, go to TCP Dump Command Arguments.
- Select Use Arguments.
- From the Network drop-down list, select a network configured on the Firebox.
- From the Interface drop-down list, select an interface configured on the Firebox.
- (Optional) To save the TCP Dump data directly to a packet capture (.PCAP) file, select Stream Data to a File.
- Click Run.
- To stop TCP Dump, click
 .
. - (Optional) If you selected Stream Data to a File, you can select Download PCAP File after TCP Dump completes.
If you select a FireCluster, the Network and Interface drop-down lists are not available for TCP Dump.
Use DNS Lookup
To run DNS Lookup:
- Select Monitor > Devices.
- Select a Firebox.
- From the Devices menu, select Live Status > Diagnostic Tools.
The Diagnostic Tools page opens. - From the Task drop-down list, select DNS Lookup.
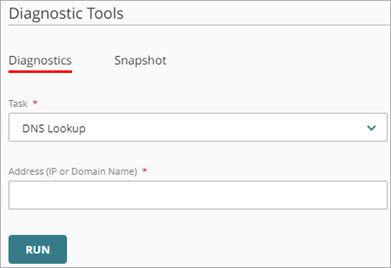
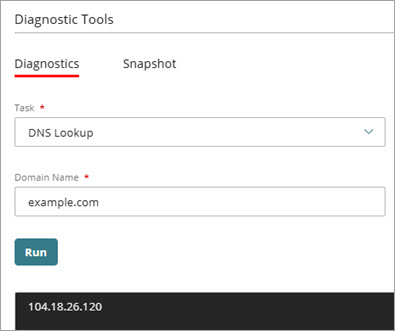
- In the Address text box, type an IP address or domain name.
- Click Run.
DNS Lookup results appear.
Use Traceroute
To run Traceroute:
- Select Monitor > Devices.
- Select a Firebox.
- From the Devices menu, select Live Status > Diagnostic Tools.
The Diagnostic Tools page opens. - From the Task drop-down list, select Traceroute.
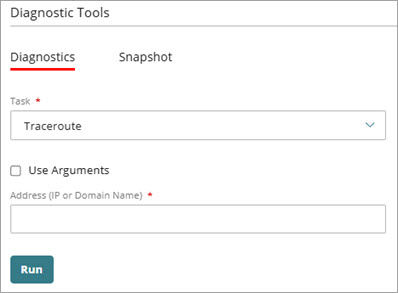
- (Optional) To narrow the results, use arguments:
- Select Use Arguments.
The Arguments text box opens. - In the Arguments text box, type one or more Traceroute arguments. For example, you can specify the number of probes for each hop, set a maximum hop limit, or change the wait time for responses. Arguments are case-sensitive. For more information about Traceroute arguments, go to Traceroute Command Arguments.
- Select Use Arguments.
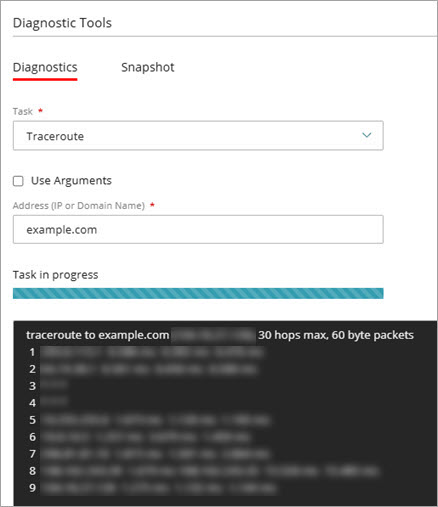
- In the Address text box, type an IP address or domain name.
- Click Run.
Traceroute results appear.
Download Diagnostic Snapshot File
Your cloud-managed Firebox collects log data and other system information that is helpful when you troubleshoot system problems with a WatchGuard Technical Support representative. You can download this information from your Firebox in a diagnostic log message file ([device name]_support.tgz) that you can send to your Technical Support representative.
You can also download the diagnostics file for a cloud-managed Firebox in the local Fireware Web UI. For more information, go to Download the Diagnostics File for a Cloud-Managed Firebox in Fireware Web UI.
To download a diagnostic snapshot file:
- Select Monitor > Devices.
- Select a Firebox.
- From the Devices menu, select Live Status > Diagnostic Tools.
The Diagnostic Tools page opens. - Select the Snapshot tab.
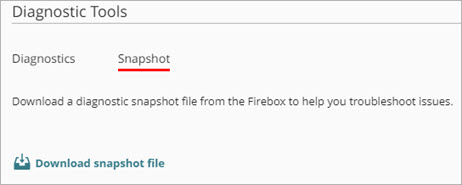
- Select Download snapshot file.
The diagnostic snapshot file downloads and saves to the location you specify.
Ping IPv4 Command Arguments
To send ICMP echo requests with Ping IPv4, in the Arguments text box, you can type these command arguments:
ping [-LRUbdfnqrvVaA] [-c count] [-i interval] [-w deadline] [-p pattern] [-s packetsize] [-t ttl] [-I interface or address] [-M mtu discovery hint] [-S sndbuf] [ -T time stamp option ] [ -Q tos ] [hop1 ...] destination
The parameters in Ping IPv4 commands are case-sensitive.
For example:
- To send 5 echo requests to a host, type -c 5. In this example, to limit the number of packets, type:
- -c to set the packet count.
- To set the interval between packets to 2 seconds, type -i 2. In this example, to control the delay between packets, type:
- -i to set the interval.
- To set the packet size to 128 bytes, type -s 128. In this example, to change the packet size, type:
- -s to specify the packet size.
- To set the Time To Live (TTL) to 64, type -t 64. In this example, to control the hop limit, type:
- -t to set the TTL.
- To force IPv4, type -4. In this example, to specify the IP version, type:
- -4 for IPv4.
- To specify an interface, type -I eth0. In this example, to send packets through a specific interface, type:
- -I to select the interface.
- To set a deadline of 10 seconds for the ping operation, type -w 10. In this example, to limit the total time, type:
- -w to set the deadline.
For more information about Ping IPv4 arguments, go to ping(8) — Linux manual page (external documentation).
Ping IPv6 Command Arguments
To send ICMP echo requests with Ping IPv6, in the Arguments text box, you can type these command arguments:
ping6 [-LUdfnqrvVaA] [-c count] [-i interval] [-w deadline] [-p pattern] [-s packetsize] [-t ttl] [-I interface] [-M mtu discovery hint] [-S sndbuf] [-F flow label] [-Q traffic class] [hop1 ...] destination
The parameters in Ping IPv6 commands are case-sensitive.
For example:
- To send 5 echo requests to a host, type -c 5. In this example, to limit the number of packets, type:
- -c to set the packet count.
- To set the interval between packets to 2 seconds, type -i 2. In this example, to control the delay between packets, type:
- -i to set the interval.
- To set the packet size to 128 bytes, type -s 128. In this example, to change the packet size, type:
- -s to specify the packet size.
- To set the Time To Live (TTL) to 64, type -t 64. In this example, to control the hop limit, type:
- -t to set the TTL.
- To specify an interface, type -I eth0. In this example, to send packets through a specific interface, type:
- -I to select the interface.
- To set a deadline of 10 seconds for the ping operation, type -w 10. In this example, to limit the total time, type:
- -w to set the deadline.
- To set a flow label for IPv6 packets, type -F 12345. In this example, to add a flow label, type:
- -F to specify the flow label.
For more information about Ping IPv6 arguments, go to ping(8) — Linux manual page (external documentation).
Traceroute Command Arguments
To trace the route to a destination, in the Arguments text box, you can type these command arguments:
traceroute [-46dFITnreAUDV] [-f first_ttl] [-g gate,...] [-i device] [-m max_ttl] [-N squeries] [-p port] [-t tos] [-l flow_label] [-w MAX,HERE,NEAR] [-q nqueries] [-s src_addr] [-z sendwait] [--fwmark=num] host [packetlen]
The parameters in traceroute commands are case-sensitive.
For example:
- To set the maximum number of hops to 30, type -m 30. In this example, to control the hop limit, type:
- -m to set the maximum hop (TTL).
- To send 3 probes for each hop, type -q 3. In this example, to control how many probe packets are sent at each hop, type:
- -q to set the number of probes.
- To wait up to 2 seconds for each probe reply, type -w 2. In this example, to adjust the timeout for responses, type:
- -w to set the wait time (seconds).
- To start measuring at hop 5, type -f 5. In this example, to skip the first few local hops, type:
- -f to set the initial TTL (first hop).
- To use ICMP Echo probes (instead of UDP), type -I. In this example, to switch probe protocol, type:
- -I for ICMP Echo.
- To use TCP SYN probes (useful if ICMP/UDP are filtered), type -T. In this example, to switch probe protocol, type:
- -T for TCP SYN.
- To specify a destination port (for UDP/TCP modes), type -p 443. In this example, to set the base destination port, type:
- -p to specify the port.
- To force IPv4 or IPv6, type -4 or -6. In this example, to select the IP version, type:
- -4 for IPv4 or -6 for IPv6.
Some environments might not support all traceroute options. If an option is not supported, the command might ignore it or return an error.
TCP Dump Command Arguments
To view information about the packets transmitted across your network (tcpdump), in the Arguments text box, you can type these command arguments:
tcpdump [-aAbdDefIKlLnNOpPqRStuUvxX] [-B size] [-c count] [ -E algo:secret ] [-i interface] [-M secret] [-s snaplen] [-T type] [-y datalinktype] [expression]
The parameters in tcpdump commands are case-sensitive.
For example:
- To view all port 443 traffic on the eth0 interface, type -i eth0 port 443. In this example, to capture packets on an interface, type:
- -i to filter packets on an interface.
- port to filter data on a port.
- To view all the port 53 traffic on the eth1 interface from or to the 10.0.1.10 internal server, type -i eth1 host 10.0.1.10 and port 53. In this example, type:
- host to filter data for a host.
- port to filter data on a port.
- To view all traffic, except port 53 traffic, on the vlan2 interface to or from the 10.0.2.20 internal server, type -i vlan2 host 10.0.2.20 and not port 53. In this example, to exclude all data from port 53, add the condition not.
- To view all IPSec traffic on the eth0 interface to or from a remote host, type - i eth0 host 203.0.113.50 and (port 500 or port 4500 or esp).
- To limit the capture to four packets on the eth0 interface, type -i eth0 -c 4. In this example, to limit the capture of packets, type -c.
For more information about TCP dump arguments, go to tcpdump.org.
Run Network Diagnostic Tasks in Fireware Web UI
Run a BOVPN Diagnostic Report for a Firebox or FireCluster
WatchGuard Cloud TCP Dump Diagnostics video tutorial (5 minutes)