Applies To: WatchGuard Core MDR, WatchGuard Core MDR for Microsoft, WatchGuard Total MDR, WatchGuard Open MDR
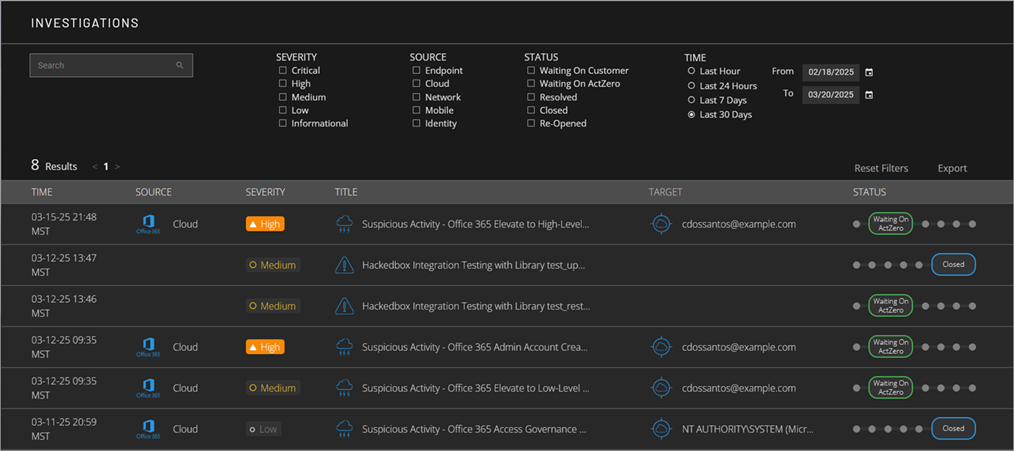
The Investigations page in the Managed Services portal shows a list investigations for your account. Based on activity for an investigation, WatchGuard sends to your team alerts about important actions we took to protect your environment or about items you need to investigate further.
If no data shows in the Managed Services portal, the service is active but no detections have occurred. The portal shows data only after an event with potential security implications is detected. After you allocate users from the WatchGuard MDR license, it might take up to six hours for activity to show in the portal.
To open the Investigations page:
- In WatchGuard Cloud, select Monitor > Managed Services.
The Managed Services portal opens in a new browser tab. - If you are a Service Provider, select your Subscriber account from the drop-down list.
- Select Activity > Investigations.
The Investigations page opens.
Investigation Status
When WatchGuard MDR detects a potential threat, the detection becomes an investigation. The investigation status initially shows as Waiting on ActZero then changes as WatchGuard MDR investigates the incident and works with you to resolve the issue or potential threat.
An investigation can be in one of these states:
Waiting on ActZero
WatchGuard MDR analysts are investigating the issue.
Waiting on Customer
WatchGuard MDR is waiting for you to confirm that the issue is resolved, respond to the investigation with a comment, or take the next necessary steps to resolve the issue.
Resolved
The issue is solved. There are no pending actions for you or WatchGuard MDR.
Closed
The investigation is closed. After 48 hours in Resolved status, an investigation moves to Closed status automatically.
Re-Opened
The investigation was re-opened. If you add a comment to a closed investigation, the status changes to Re-Opened.
Review Investigation Details
The list in the Investigations page shows investigations that match your filters.
To review the details of an investigation, select the investigation from the list.
The details open to the right of the list.
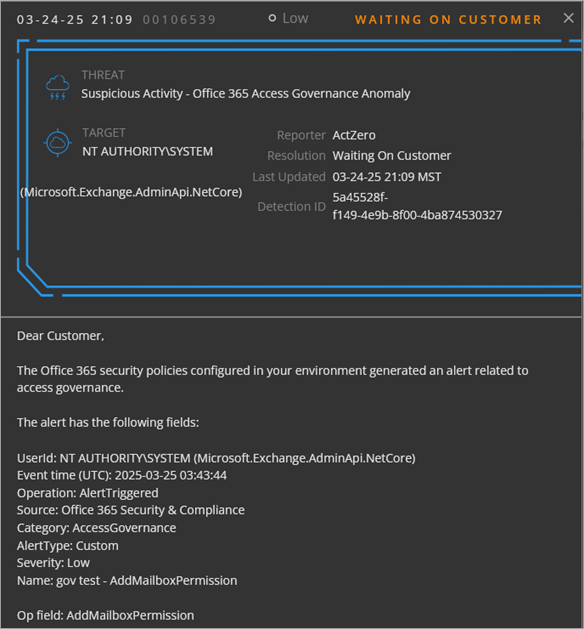
The investigation details include the alert date and time, severity level, ticket status, last updated date and time, detection ID, and the full text of the alert email message sent to the customer. The message provides details about the potential threat and recommendations to remediate the incident.
The severity level for investigations in the Managed Services portal might not match the incident severity level that shows in ThreatSync.
To view the detection that generated the investigation in the Detections page, click the Detection ID. You can also respond to the investigation.
Respond to an Investigation
When the status of an investigation is Waiting On Customer, you can take an action or respond to WatchGuard MDR with a comment.
Take Action from the Portal (Microsoft 365 Only)
If available, you can click the Disable User button in the investigation details to disable the impacted Microsoft 365 user account. This logs the user out of all active sessions, resets the user password, and resets MFA for the user. The end user experience depends on your Microsoft 365 configuration.
The Disable User button resets MFA for the user only if the authentication method for the user is set to Reset Password or Microsoft Authenticator.
Take Action in Your Network or Environment
If the message in the alert details suggests steps to remediate the incident, you can take action directly in your network or environment. After you complete the recommended steps, add a comment to the incident details with the actions you took.
Respond With a Comment
To send WatchGuard MDR information about the investigation, scroll to the bottom of the alert details. In the Comment text box, type your message and click Update. The investigation status changes to Waiting on ActZero.
For more information about the response actions WatchGuard MDR can take to respond to threats in your environment, go to What are the response capabilities of WatchGuard MDR? in the WatchGuard Knowledge Base.
Sort and Filter the Investigations List
By default, the investigations list shows all investigations for the selected time period, sorted by time in descending order, so the most recent investigations appear first in the list. To change the order of the investigations, click a column header.
To customize which investigations you see, you can filter the list by date, severity, source, status, and time.
Severity
To filter the investigations list by severity, from the severity list, select one or more options.
Source
To filter the investigations list by source, select one or more of these options:
- Endpoint — Connected endpoints that run WatchGuard Endpoint Security, Microsoft Defender, and CrowdStrike EDR.
- Cloud — Connected cloud services, such as Microsoft 365. For accounts with WatchGuard Total MDR or WatchGuard Open MDR, this includes connected AWS CloudTrail and Google Workspace cloud services.
- Network — For accounts with WatchGuard Total MDR, connected Fireboxes and ThreatSync+ NDR. For accounts with WatchGuard Open MDR, connected Fireboxes, ThreatSync+ NDR, and supported third-party firewalls.
- Identity — For accounts with WatchGuard Total MDR, credential access incidents from AuthPoint. For accounts with WatchGuard Open MDR, credential access incidents from AuthPoint, Okta, and Duo.
Status
To filter the investigations list by status, select one or more options.
Time
By default, the investigations list shows investigations that occurred in the last 30 days. To filter the investigations list by date range, in the Time section, select a time period or a custom date range.
The data retention period for investigation data is 365 days.
To reset the filters, click Reset Filter. To export the list of investigations to a .CSV file, click Export.