Applies To: WatchGuard Core MDR, WatchGuard Core MDR for Microsoft, WatchGuard Total MDR, WatchGuard Open MDR
The Detections page in the Managed Services portal shows information about security detections in your environment. Detections are events with potential security implications. WatchGuard MDR automatically blocks or manually investigates detections, as needed.
Different WatchGuard MDR products support different types of detections.
| Source | Detection | WatchGuard Core MDR | WatchGuard Core MDR for Microsoft | WatchGuard Total MDR | WatchGuard Open MDR |
|---|---|---|---|---|---|
| Endpoint | Endpoints WatchGuard Endpoint Security Elite, Endpoint Security 360, or Endpoint Security Prime | Yes | No | Yes | Yes |
| Endpoints with Microsoft Defender for Endpoints | No | Yes | No | Yes | |
| CrowdStrike EDR | No | No | No | Yes | |
| Cloud | Microsoft 365 | Yes | Yes | Yes | Yes |
| AWS CloudTrail | No | No | Yes | Yes | |
| Google Workspace | No | No | Yes | Yes | |
| Network | Fireboxes | No | No | Yes | Yes |
| ThreatSync and ThreatSync+ NDR | No | No | Yes | Yes | |
| Supported Third-party Firewalls | No | No | No | Yes | |
| Identity | AuthPoint | No | No | Yes | Yes |
| Okta | No | No | No | Yes | |
| Duo | No | No | No | Yes |
The Managed Services portal shows these ThreatSync incidents as detections:
- AuthPoint (Identity)
- Fireboxes (Network)
- ThreatSync+ NDR (Network)
The Managed Services portal does not include detections for these ThreatSync incidents:
- Access points
- ThreatSync+ Saas
For more information about the incidents ThreatSync supports, go to Incident Types and Triggers in ThreatSync.
Endpoint detections are based on data received directly from Endpoint Security. Endpoint detections in the Managed Service portal do not use ThreatSync incident data.
To see a list of example detections, go to MDR Cloud Detection Examples.
View Detections
The first section of the Detections page includes tiles with graphs that show the number of detections over time by severity and by source. It also includes a tile that shows trend data analysis over the last 30 days. You can configure filters to show specific detections and then see detection details in the last section of the page.
If no data shows in the Managed Services portal, the service is active but no detections have occurred. The portal shows data only after an event with potential security implications is detected. After you allocate users from the WatchGuard MDR license, it might take up to six hours for activity to show in the portal.

To open the Detections page:
- In WatchGuard Cloud, select Monitor > Managed Services.
The Managed Services portal opens in a new browser tab. - If you are a Service Provider, select your Subscriber account from the drop-down list.
- Select Activity > Detections.
The Detections page opens.
View Data Graphs
The Detections page contains tiles with graphs that show detection data over time.
Total By Severity
The Total By Severity tile shows the total number of detections by severity over time. By default, the tile shows only Critical and High severity detections. Use the filters to show additional severity levels or change the date range for the graph.
The severity level for detections in the Managed Services portal might not match the incident severity level that shows in ThreatSync.

Total by Source
The Total By Source tile shows the total number of detections by source over time. Use the filters to change the sources and date range for the graph.

The source indicates the origin of the data sent to WatchGuard MDR. The available sources are:
- Endpoint — Connected endpoints that run WatchGuard Endpoint Security, Microsoft Defender, and CrowdStrike EDR.
- Cloud — Connected cloud services, such as Microsoft 365. For accounts with WatchGuard Total MDR, this includes connected AWS CloudTrail and Google Workspace cloud services.
- Network — For accounts with WatchGuard Total MDR, connected Fireboxes and ThreatSync+ NDR. For accounts with WatchGuard Open MDR, connected Fireboxes, ThreatSync+ NDR, and supported third-party firewalls.
- Identity — For accounts with WatchGuard Total MDR, credential access incidents from AuthPoint. For accounts with WatchGuard Open MDR, credential access incidents from AuthPoint, Okta, and Duo.
Trends
The Trends tile shows the percentage change of detections and the total number of detections (by severity) for the last 30 days.

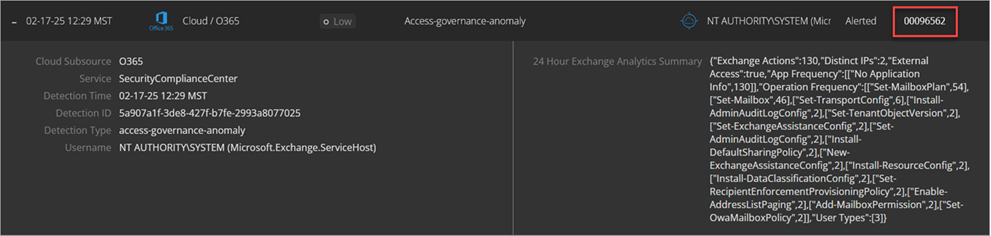
Review Detection Details
The list in the lower section of the Detections page shows detections that match your filters. The list includes the date and time of the detection, the source, severity, detection type, target, actions, and case number.
- To review the details of a detection, select the detection from the list.
The details open to show additional information.
- To go to the investigation opened for the detection, click the Case Number.
The investigation details open in the Investigations page.
For more information about investigations, go to Review MDR Investigations.
Sort and Filter the Detections List
By default, the detections list shows all critical and high severity detections for the selected time period, sorted by time in descending order, so the most recent investigations appear first in the list. To change the order of detections, click a column header.
To customize which detections show in the list, you can filter the list by severity, source, and status.
Severity
To filter the detections list by severity, select one or more options.
Source
To filter the detections list by source, select one or more of these options:
- Endpoint — Connected endpoints that run WatchGuard Endpoint Security, Microsoft Defender, and CrowdStrike EDR.
- Cloud — Connected cloud services, such as Microsoft 365. For accounts with WatchGuard Total MDR or WatchGuard Open MDR, this includes connected AWS CloudTrail and Google Workspace cloud services.
- Network — For accounts with WatchGuard Total MDR, connected Fireboxes and ThreatSync+ NDR. For accounts with WatchGuard Open MDR, connected Fireboxes, ThreatSync+ NDR, and supported third-party firewalls.
- Identity — For accounts with WatchGuard Total MDR, credential access incidents from AuthPoint. For accounts with WatchGuard Open MDR, credential access incidents from AuthPoint, Okta, and Duo.
Action
To filter the detections list by action, select one or more of these options:
- Logged — WatchGuard MDR detected a potential threat.
- Alerted — WatchGuard MDR generated a ticket for investigation.
- Blocked — WatchGuard MDR blocked the detected threat.
- Killed — WatchGuard MDR killed a detected process tree execution.
- Quarantine — WatchGuard MDR isolated the endpoint.
- Scanned — WatchGuard MDR scanned the endpoint for issues.
Time
By default, the detections list shows detections that occurred in the last 30 days. To filter the detections list by date range, in the Time section, select a time period or a custom date range.
The data retention period for detection data is 365 days.
To reset the filters, click Reset Filter. To export the list of investigations to a .CSV file, click Export.
MDR Cloud Detection Examples
WatchGuard regularly evaluates the attack surface, works with security analysts, and adds new detections to the MDR pipeline to protect your infrastructure from malicious actors.
To protect our customers and to maintain competitive integrity, WatchGuard does not publish a comprehensive detection catalog. The following example detections represent a small sample from the extensive list of WatchGuard MDR detections.
Microsoft O365 Detections
Identity and Access
Focus
- Anomalous geographies
- Impossible travel
- Suspicious user agents
- Brute‑force outcomes
- MFA administration risk
Examples
- O365 anomalous country login
- User login location and impossible travel anomaly
Admin and Privilege Changes
Focus
- Rapid admin assignment
- Role elevation
- Account enablement by newly‑privileged accounts
Examples
- O365 elevate to high‑level administrator
- O365 create admin account
Email and Collaboration Security
Focus
- Malicious URL clicks
- Anomalous inbox rules
- Send restrictions
- Anti‑spam/phish/malware guardrails
Examples
- O365 anomalous new inbox rule
- O365 potentially malicious URL clicked
Data Protection and DLP
Focus
- Exfiltration anomalies
- Bulk restore behavior
- External sharing policy changes
Examples
- Office 365 data exfiltration attempt anomaly
- Office 365 multiple file restore
Governance, Audit, and eDiscovery
Focus
- eDiscovery role changes or exports
- Access governance alerts
Examples
- O365 eDiscovery manager changed
- O365 eDiscovery search exported by new admin
Security Controls Tampering
Focus
- Attempts to weaken defenses
- Audit logs off
- Safe links/attachments
- Anti‑spam/phish/malware policies disabled/removed
Examples
- O365 audit log disabled
- O365 safe links disabled
Behavioral Analytics and Anomaly Engine
Focus
- AI‑driven behavioral analytics
Examples
- O365 Sixth Sense Longcycle
- O365 suspicious login detection
AWS Detections
Identity and Access
Focus
- Root account usage, credential abuse
- Anomalous login patterns
- Impossible travel
- Login anomalies
- Brute-force success
Examples
- AWS root login
- Brute-force successful user login
Admin and Control Plane Integrity
Focus
- Critical configuration changes that weaken visibility or security posture
- Disabling logging
- Deleting trails
- Removing detectors
Examples
- AWS stop logging
- DeleteDetector
Network and Infrastructure Security
Focus
- Destructive actions or exposure risks in core infrastructure
- Virtual Private Cloud (VPC)
- Subnets
- Flow logs
Examples
- DeleteVpc
- DeleteSubnet
- DeleteFlowLogs
Data Protection and Storage Security
Focus
- Public exposure or tampering with storage and encryption settings
- S3 buckets
- Snapshots
- EBS encryption
Examples
- AWS public S3 bucket
- DisableEbsEncryptionByDefault
Database and Compute Resource Hardening
Focus
- Misconfigurations or destructive actions in RDS clusters and AMIs
- Public snapshots
- AMI sharing
Examples
- DeleteDBCluster
- AWS AMI made public
Governance and Logging Integrity
Focus
- Attempts to disable or delete audit trails
- Log validation
- Multi-region logging
Examples
- AWS DeleteTrail
- AWS disable multi-region logging
Behavioral Analytics and Anomaly Detection
Focus
- AI-driven detection of suspicious user behavior
- Login anomalies
- Impossible travel
- Credential stuffing
Examples
- User login time anomaly and impossible travel anomaly
- Credential stuffing
Google Workspace Detections
Identity and Access
Focus
- Account takeover indicators
- Anomalous login patterns
- Brute-force attempts
- Logins from bad reputation IPs
Examples
- User login location and impossible travel anomaly
- Brute-forced successful user login
Account and Security Policy Integrity
Focus
- Suspicious account state changes and security posture downgrades
- User suspension
- Unenrollment from advanced protections
Examples
- G-Workspace user suspended
- G-Workspace Advanced Protection unenroll
Email and Collaboration Security
Focus
- Risky email forwarding configurations and out-of-domain forwarding that could enable data exfiltration
Examples
- G-Workspace out of domain email forwarding enabled
Threat Intelligence and Attack Warnings
Focus
- Alerts from Google on government-backed attacks and emerging threats
Examples
- G Suite attack warning
- Emerging threat
Behavioral Analytics and Anomaly Detection
Focus
- AI-driven detection of unusual user behavior
- Login time anomalies
- Impossible travel
- Credential abuse
Examples
- Login time and impossible travel anomaly
- Bad reputation login