Applies To: Endpoint Security Elite
To review the details of monitored and collected events that occurred on a computer on a specific day, you can start a computer investigation. You can start a computer investigation from the Computer Details page or from the Incident Details page. Go to the appropriate section:
- Create a Computer Investigation from the Computer Details Page
- Create a Computer Investigation from the Incident Details Page
Create a Computer Investigation from the Computer Details Page
Your operator role determines what you can see and do in WatchGuard Cloud. Your role must have the Access Advanced Telemetry permission to view or configure this feature. For more information, go to Manage WatchGuard Cloud Operators and Roles.
- In the Endpoint Security management UI, select Computers, then select a computer.
The computer investigation for the selected computer opens. - To create a computer investigation for another computer, on the Investigation page, click
 .
. - Select Computer Investigation.
The Investigate Computer page opens. - Select the MUID or Computer Name check box and enter the unique identifier or Windows computer name in the text box.
- In the From text boxes, select the start date and time for the investigation.
- In the To text boxes, select the end date and time for the investigation.
- From the Time Zone drop-down list, select the time zone.
- Click OK.
A computer investigation is created.


The date range cannot be greater than two days. You can select a date up to seven days prior.
Create a Computer Investigation from the Incident Details Page
On the Incident Details page, you can start an investigation for the computer affected by the incident. For information on incident details, go to Review Incident Details in Endpoint Security.
Your operator role determines what you can see and do in WatchGuard Cloud. Your role must have the Access Advanced Telemetry permission to view or configure this feature. For more information, go to Manage WatchGuard Cloud Operators and Roles.
To start a computer investigation from the Incident Details page:
- In the Endpoint Security management UI, on the Security dashboard, select the Incidents Status tile.
The Incidents list opens.
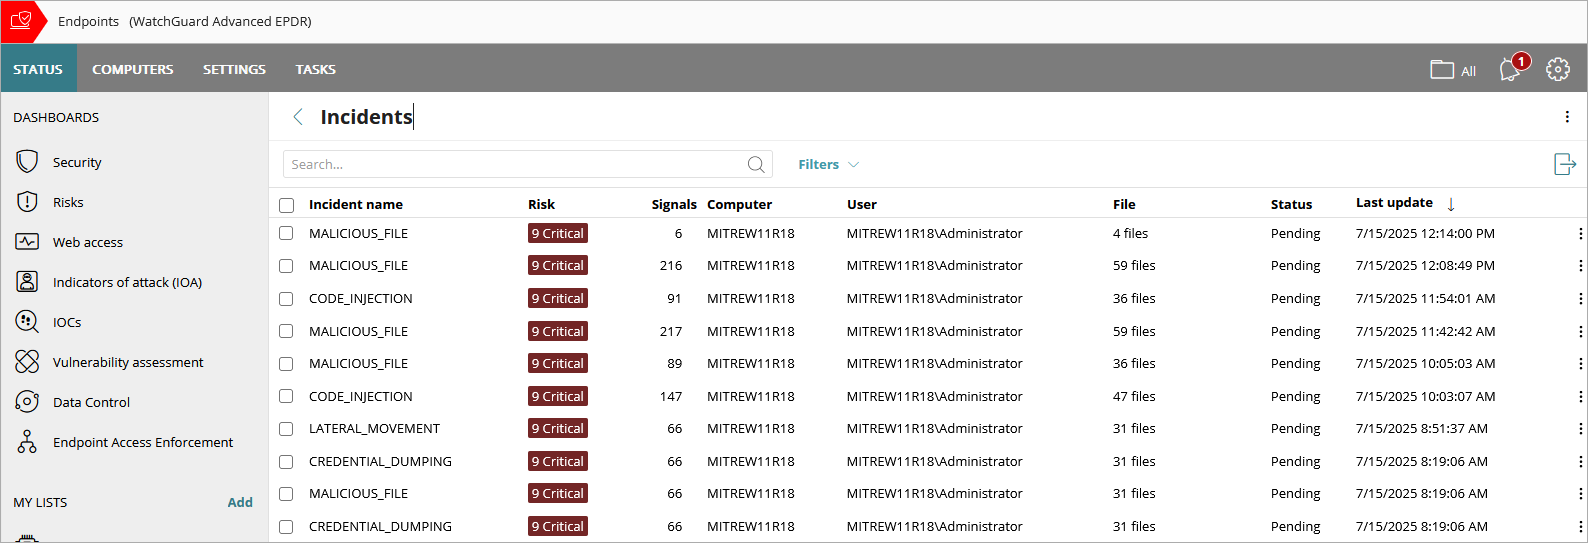
- From the Incidents list, click the name of the incident on a computer you want to investigate.
The Incident Details page opens.
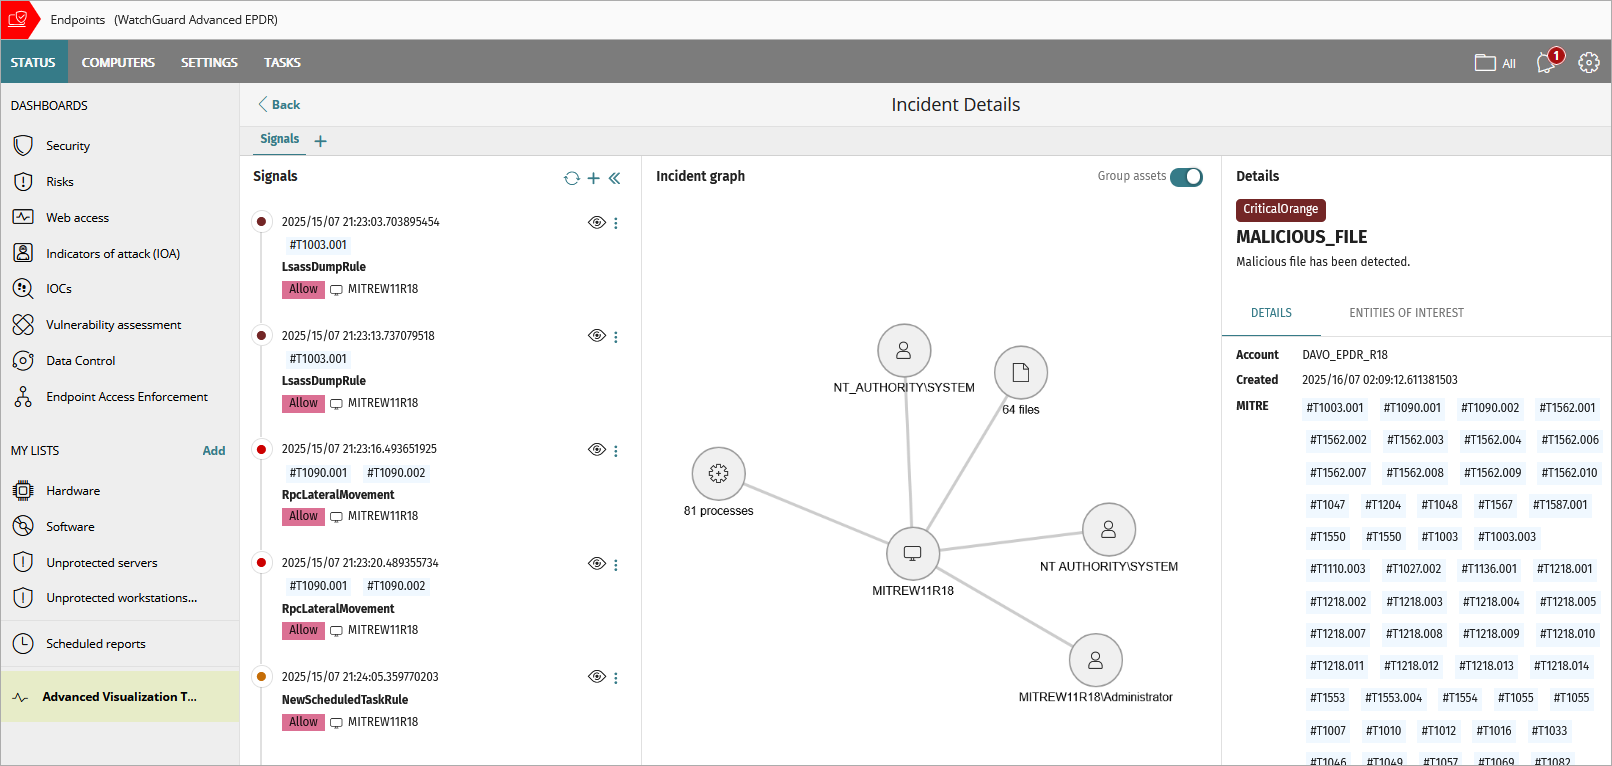
- Next to one of the signals in the list, click
 .
. - Select Investigate Computer.
The investigation opens within the Incident Details page.
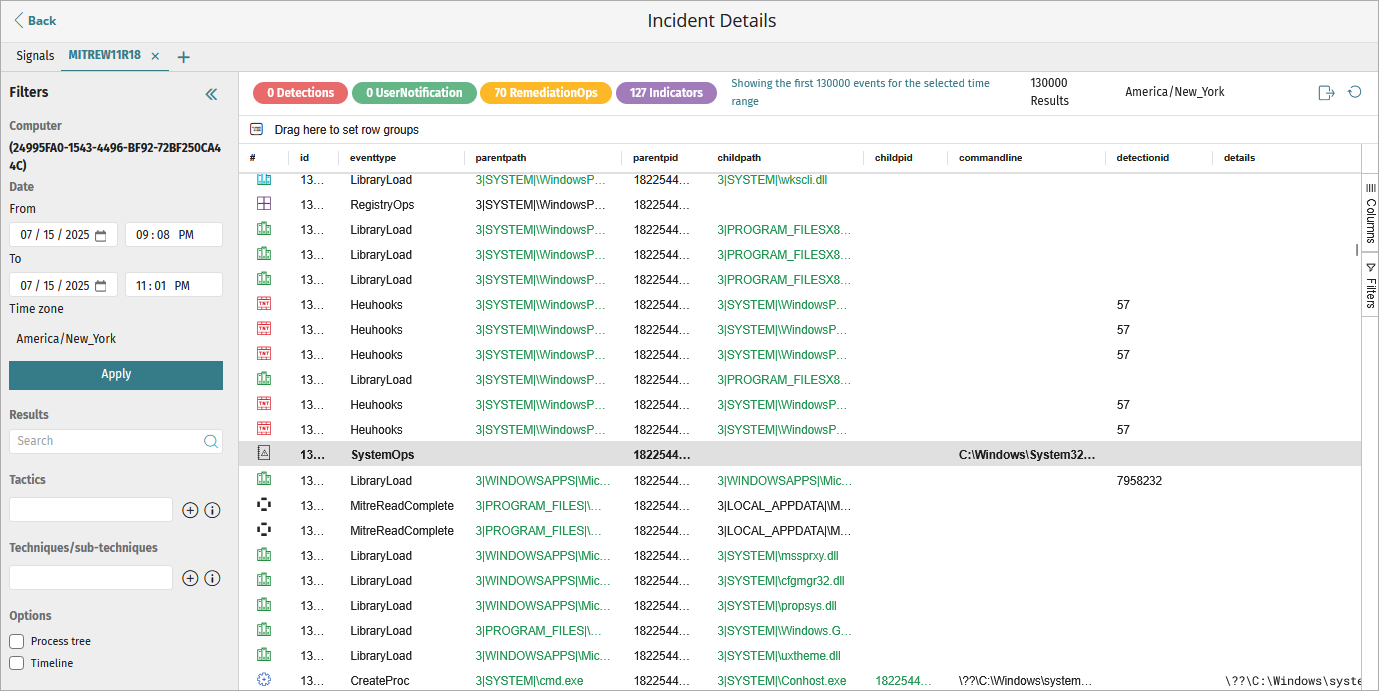
- In the From text boxes, select the start date and time for the investigation.
- In the To text boxes, select the end date and time for the investigation.
- From the Tactics drop-down list, select the MITRE tactic you want to filter the list of events for.
- From the Techniques / Sub-techniques drop-down list, select the MITRE technique and sub-technique you want to filter the list of events for.
- Click Apply.
Updated results show in the table. Select a row in the table to review more information on the event in the Details pane. - To show the process tree in the Details pane, select the Process Tree check box. For more information, go to Process Tree.
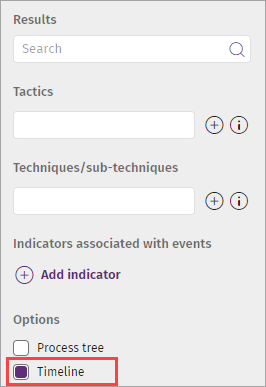
- To show the incident timeline in the middle pane, select the Timeline check box. For more information, go to View Event Graphs.
The date range cannot be greater than two days. You can select a date up to seven days prior.
About the Investigation Table
In a computer investigation, you can:
The details of the investigated events are available in a list.
The first column (#) in the list shows an icon that represents the type of event logged.
| Icon | Event |
|---|---|
|
|
Process created |
|
|
Executable file edited |
|
|
Executable program deleted |
|
|
Directory created |
|
|
Compressed file opened |
|
|
Registry entry that points to an executable file edited |
|
|
Exploit detected |
|
|
File downloaded |
|
|
Unknown process blocked because there is no interactive session on the computer |
|
|
Registry operation |
|
|
Script file run |
|
|
Amount of data transmitted over the network |
|
|
Failed DNS resolution |
|
|
The WatchGuard Agent showed a pop-up message on the user computer |
|
|
End of an interactive session on the computer |
|
|
Internal administrative event |
|
|
Operation performed by an executable file that did not log its creation |
|
|
Remote process created |
|
|
Executable file created |
|
|
Library loaded |
|
|
Executable file edited |
|
|
Compressed file created |
|
|
Registry entry created that points to an executable file |
|
|
Remote process thread created |
|
|
Unclassified event |
|
|
Network operation |
|
|
Document opened |
|
|
Script file created |
|
|
Threat detected |
|
|
Windows Management Instrumentation (WMI) event logged by SYSMON that modified the computer operating system settings |
|
|
Device control operation |
|
|
Start of an interactive session on the computer |
|
|
Action taken by the Endpoint Security product installed on the computer |
|
|
Computer restarted |
|
|
Endpoint Security detected an executable file that did not log its creation because of a temporary problem or because the file existed before the security software was installed |
For more information about the information included in events, go to Fields in the Events Received by Cytomic Orion (external link).
You can create groups of items based on values in a selected column.
To create groups:
- Drag a column to the Drag Here to Set Row Groups bar.
To view detailed telemetry collected for a specific event and information from MITRE, you can:
- Select an event.
- Right-click an event and select one of these:
- Show Computers with Parent File
- Show Computers with Child File
- Show Static Information for Parent File
- Show Static Information for Child File
- Graphs
For more information about graphs, go to Investigation Graph Window.

You can view the MITRE details only for computers with Verbose mode enabled. For more information about Verbose mode, go to Configure Verbose Mode.
Change Event Details List Columns
You can change the columns and the order of the columns in the list.
To show or hide columns in the list:
- On the Investigation page, click Columns.
A list of columns to show or hide opens. - To include an event detail in the list, select the check box for the column you want to view in the list.
The column appears in the list. - To remove an event detail, clear the check box for the column.
The column is removed from the list. - To change the order of the columns, drag the event parameter up or down in the list.

On the Investigation page, you can view colored labels for the categories of events and the total number of events logged on the investigated computer on the specified date and time.

To open a floating panel that shows the events for the selected label, click a label.
You can view these event labels:
- Detections — Threat detection events generated by the security software installed on the workstation or the server.
- UserNotifications — Events that can affect the security of the computer and require an action from the user.
- RemediationOps — Events that require the security software on the computer to take an action.
- Indicators — Generated indicators.
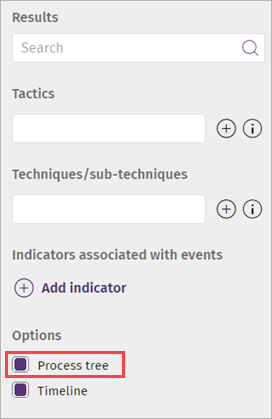
In the Filters section, you can filter your results and search for a specific event.

You can specify these parameters to filter and search events:
- Computer — Shows the name or MUID of the investigated computer.
- MD5 — Shows the MD5 of the file analyzed in the investigation.
- Date — Shows the time period for the investigation. When you click the text boxes, a calendar appears for you to change the date interval. The maximum time period is 48 hours.
- Time Zone — Set a time zone for the search. Results appear in the central pane with the time zone you define.
- Results — Filters the event list by the content you enter in the text box. Searches are performed on all the columns of the entries in the list. You can type a partial string only.
- Tactic — To filter by tactic, enter part of the tactic name or click . A list appears of the tactics associated with the events in the list.
- Technique/Sub-technique — To filter by technique or sub-technique, enter part of the technique or sub-technique name or click . A list appears of the techniques or sub-techniques associated with the events in the list.
- Add indicator — To filter by indicator, enter part of the indicator name or click . A list appears of the indicators associated with the events in the list.
- Options — Enable or disable the timeline of events and the process tree.
For information about the timeline of events, go to View Event Graphs.
For information about the process tree, go to Process Tree.
The date range cannot be greater than two days. Also, you can select a date maximum up to seven days before.
On the Investigation page, you can view the number of events that occurred for each unit of time graphically.

In the graphs, you can:
- Point your mouse over the graph to view the number of events that occurred at any specific time.
- Drag the bar left or right to change the interval for the activity shown in the graph.
- Click anywhere in the graph and drag your mouse to define a new window to view the activity. The graph updates with a new zoom level and a new time period for the available data.
To view the graphs:
- From the Filters section, select the Timeline check box.
The Process Tree shows you the hierarchy of all the processes run on the computer.

To view the process tree:
- From the Filters section, select the Process Tree check box.
In the Process Tree, you can:
- Expand a process to view the sub-processes.
- Select a process to find an event associated with a process.
- Collapse or expand the tree branches.
- Filter the process tree.