Applies To: Endpoint Security Elite
The Advanced SQL Query tool enables you to find specific events for a selected computer or any other computer on your network. You can use the Advanced SQL Query tool to review the computer telemetry recorded in the previous seven days.
To use the Advanced SQL Query tool, you must know how to use structured query language (SQL) and understand the database schema used by Endpoint Security.
The Advanced SQL Query tool is available from the Computer Details or Incident Details page. Go to the appropriate section:
- Open the Advanced SQL Query Tool from the Computer Details Page
- Open the Advanced SQL Query Tool from the Incident Details Page
Open the Advanced SQL Query Tool from the Computer Details Page
Your operator role determines what you can see and do in WatchGuard Cloud. Your role must have the Access Advanced Telemetry permission to view or configure this feature. For more information, go to Manage WatchGuard Cloud Operators and Roles.
To open the Advanced SQL Query tool, from the computer details page in the Endpoint Security management UI:
- To open computer details, select Computers, then select a computer.
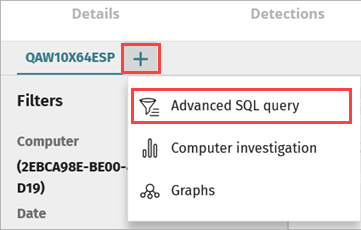
- On the Investigation tab, click
 .
. - Select Advanced SQL Query.
The Advanced SQL Query tool opens.
Open the Advanced SQL Query Tool from the Incident Details Page
Your operator role determines what you can see and do in WatchGuard Cloud. Your role must have the Access Advanced Telemetry permission to view or configure this feature. For more information, go to Manage WatchGuard Cloud Operators and Roles.
To open the Advanced SQL Query tool, from the Incident Details page in the Endpoint Security management UI:
- On the Status page next to My Lists, click Add.
- In the Add List dialog box, select Incidents.
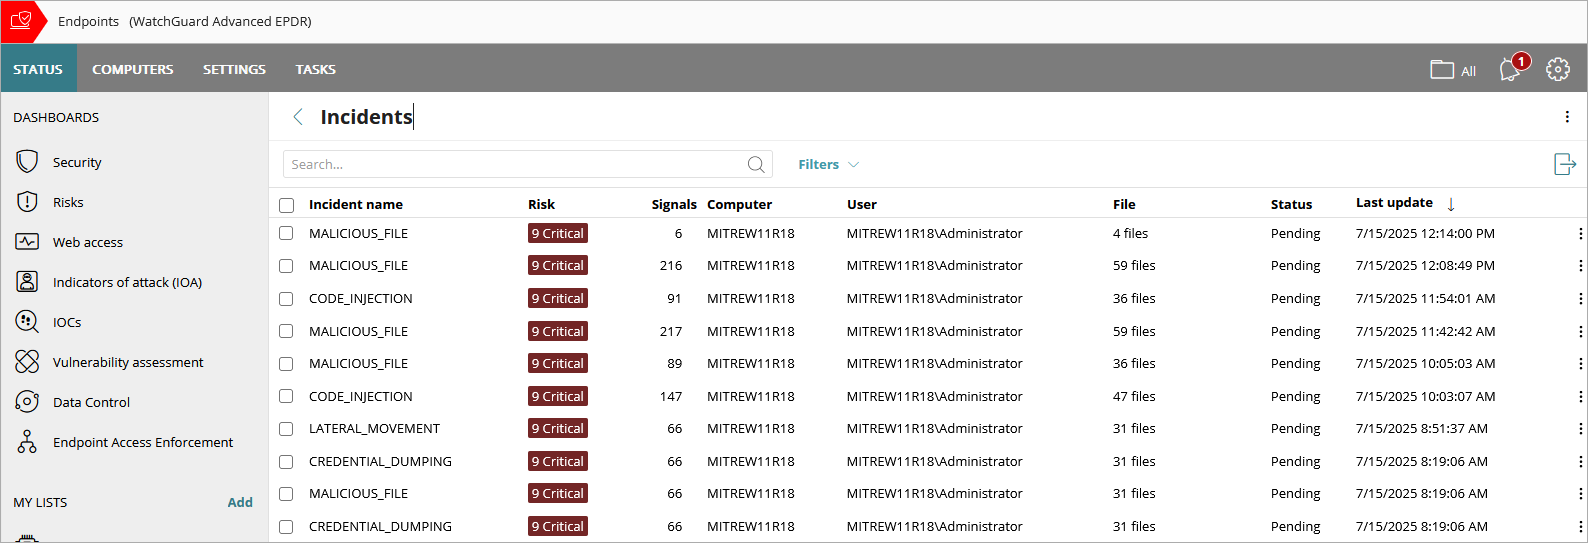
- From the Incidents list, click the name of the incident you want to investigate.
The Incident Details page opens.
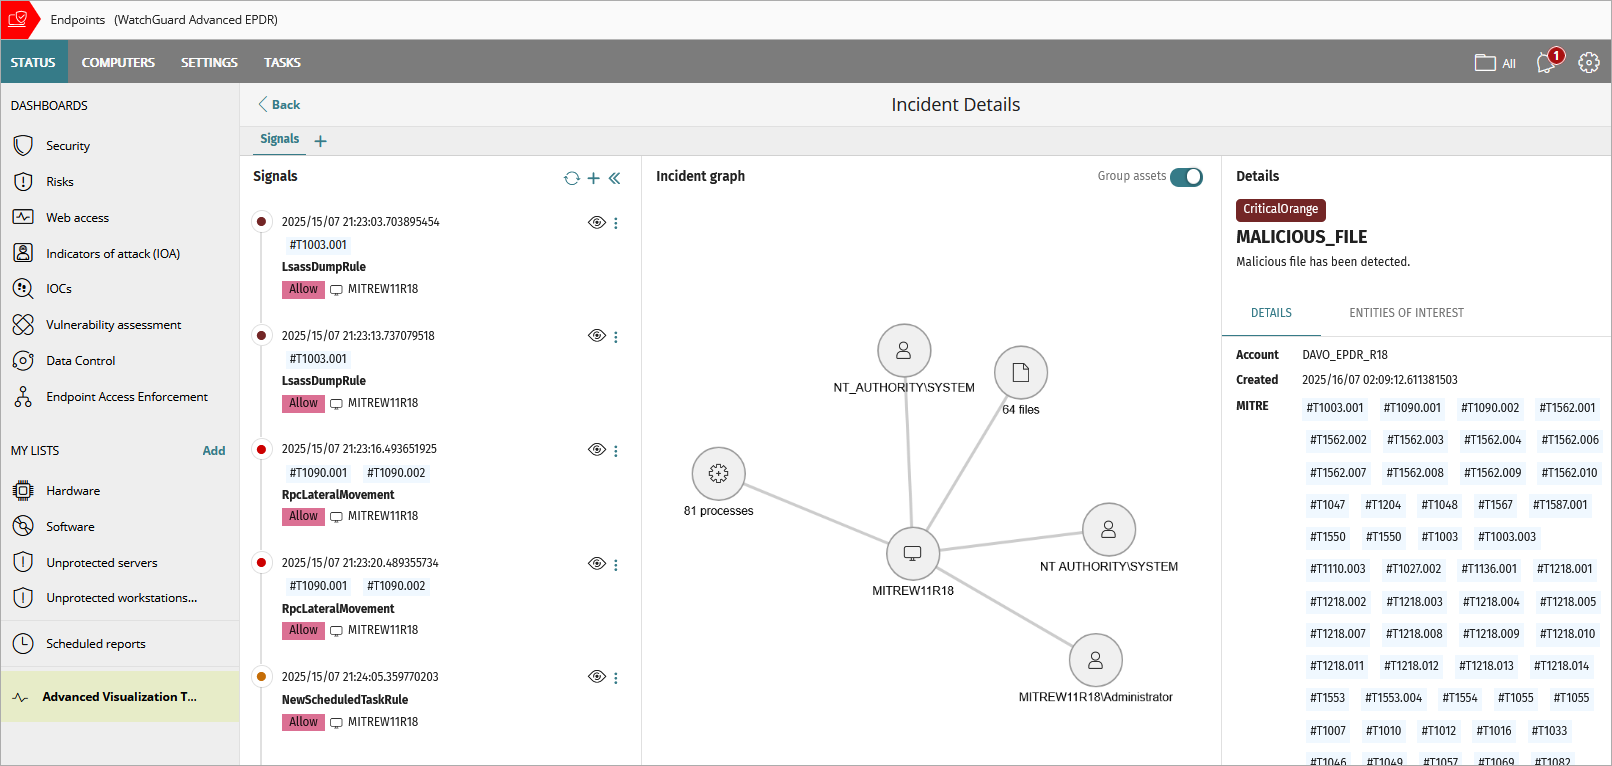
- Above the Signals pane, click
 .
.
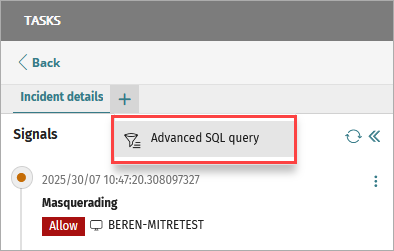
- Select Advanced SQL Query.
The Advanced SQL Query tool opens.
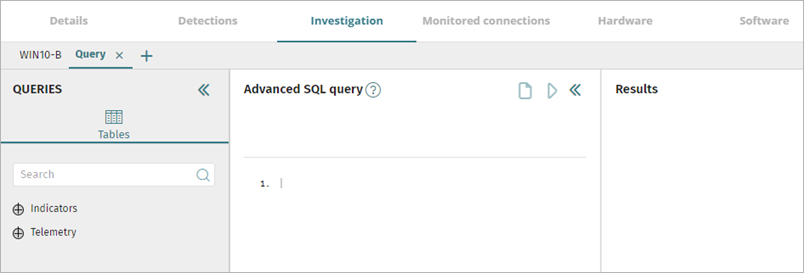
About the User Interface
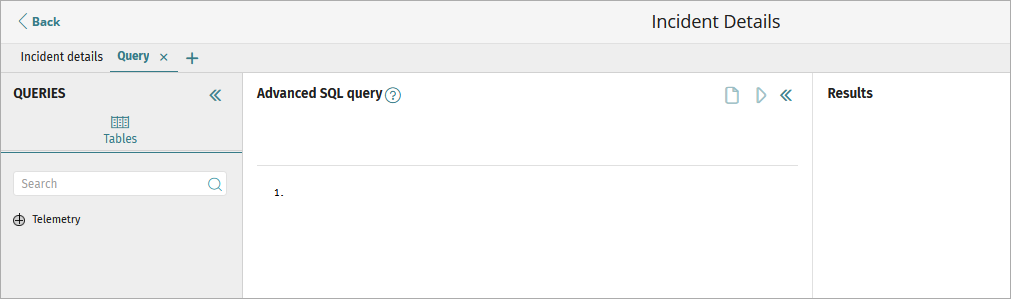
The Advanced SQL Query tool user interface is divided into these sections:
- Queries — Enables you to view and select tables and the data model.
- Advanced SQL Query — Enables you to create queries.
- Results — Shows the results of the queries.
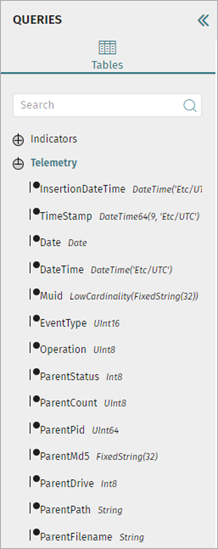
Queries Section
The Queries section of the tool shows the data model used to organize information collected from the monitoring of processes.
You can use the tables and fields shown in this section to create queries. Click a field to copy it to the Advanced SQL Query section in the position indicated by the cursor.
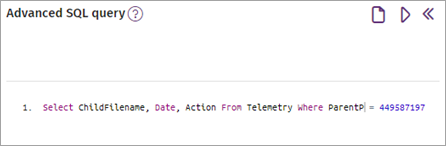
Advanced SQL Query Section
The Advanced SQL Query section includes an editor that enables you to create and run advanced SQL queries.
To run advanced SQL queries:
- In the query editor, specify the SQL query that you want to run.
- To run the query, click
 .
.
For information on SQL syntax, go to Advanced Query SQL Syntax.
For information on how to start an assisted investigation, go to About the GenAI Assistant in Endpoint Security.
Results Section
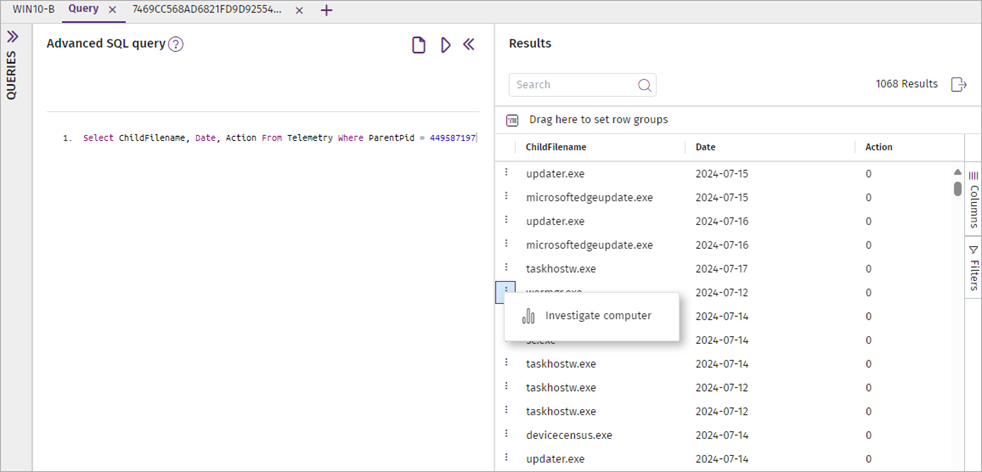
The Results section shows the results of your SQL query in table format.
In the Results section, you can perform these actions:
View Event Details
In the Results section, you can view the telemetry for a computer in the results table.
To view event details for any item in the list:
- Click
 , then select Investigate Computer.
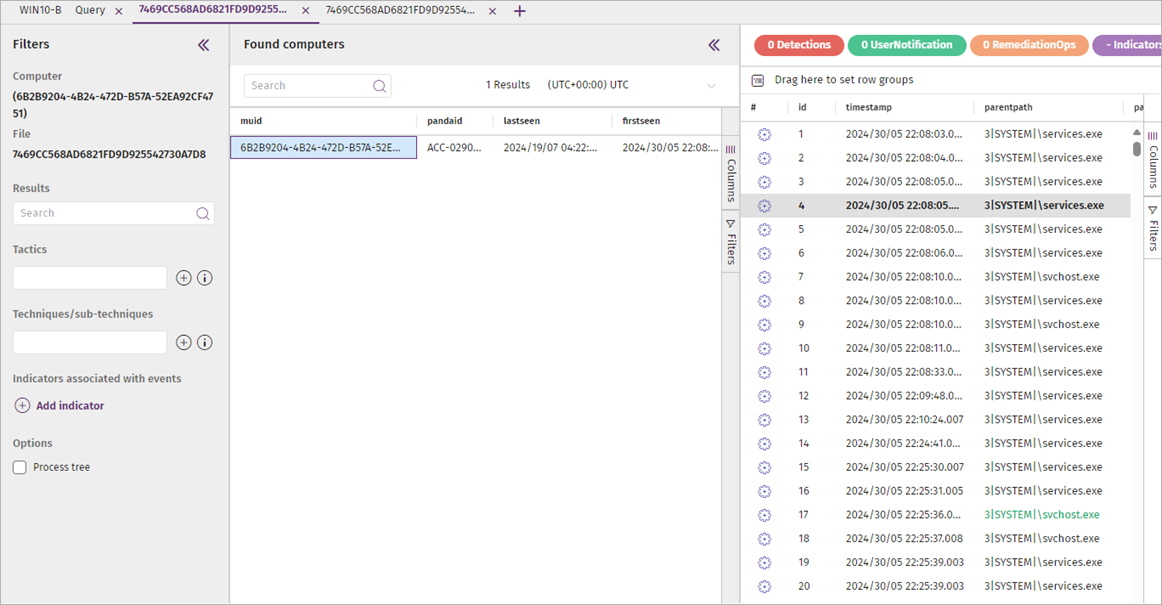
The Investigate Computer dialog box opens. - Select the check box of the identifier you want to use to identify the computer, then enter the required value in the text box:
- MUID
- MD5
- MUID + MD5
- Computer Name
- Click OK.
A new page opens with event details for the specified computer.

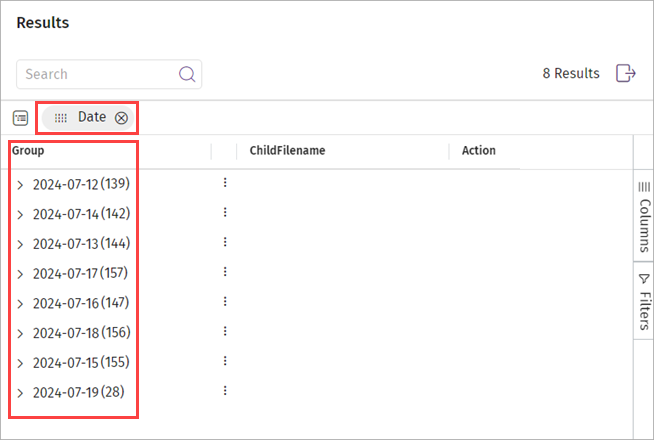
Set Row Groups
In the Results section, to help analyze details, you can create groups of items based on values in a selected column.
To create groups:
- Drag a column to the Drag Here to Set Row Groups bar. For example, you could drag the Date column.
Groups are created for the selected column.
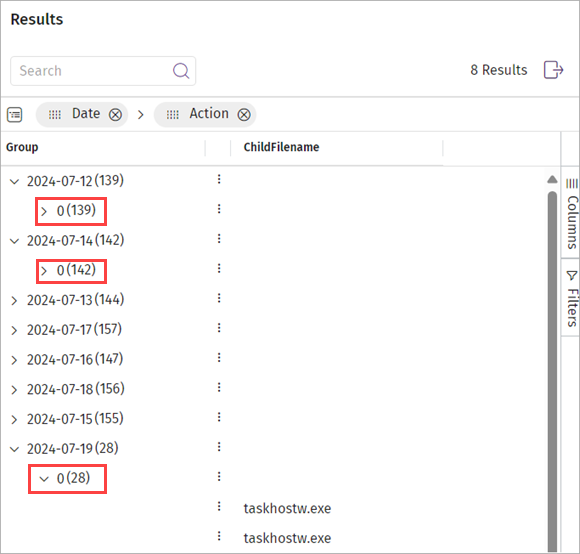
- (Optional) To create groups for other columns within the existing groups, drag additional columns to the Drag Here to Set Row Groups bar. For example, drag the Action column next to the Date column.
Sub-groups are created within the existing groups.
Search and Filter Results
In the Results section, you can search for a specific parameter in the Results table. You can also filter the results based on the data in a specific column.
To search for a specific parameter:
- Enter text in the Search box. Search matches the text in all information returned by the SQL query.
To filter the Results table:
- Click Filters.
Filter options appear. - Expand the option you want to use to filter the table.
- Select and clear check boxes for the data you want to show or hide in the Results table. By default, all check boxes are selected.
The Results table refreshes and filtered results appear in the list.


For information about the type of events, go to Fields in the Events Received by Cytomic Orion (external link).