
Related Topics
Traffic Monitor
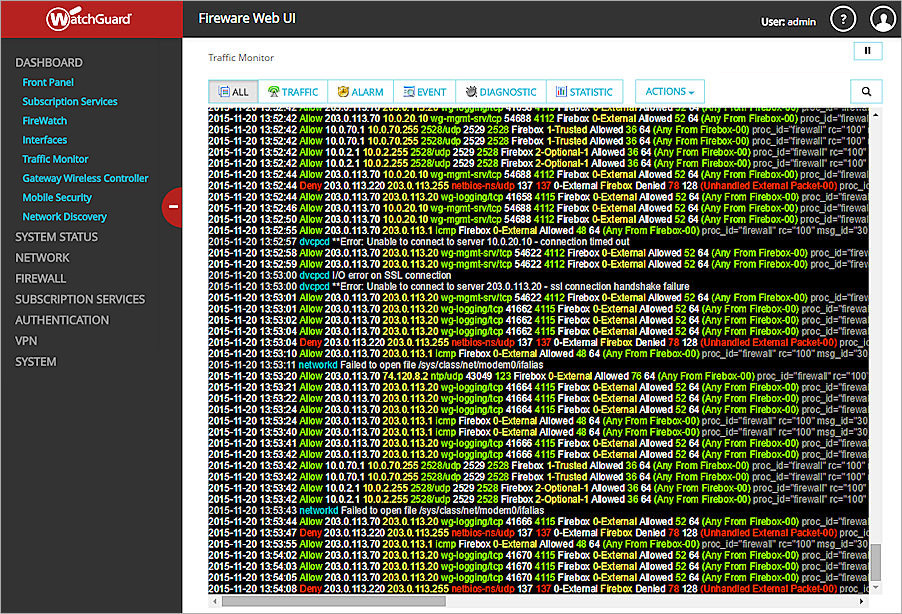
On the Traffic Monitor page, you can see log messages from your Firebox as they occur. On some networks, there can be a short delay as log messages are sent.
Traffic Monitor can help you troubleshoot network performance. For example, you can see which policies are used most, or whether external interfaces are constantly used to their maximum capacity.
- Connect to Fireware Web UI for your Firebox.
- Select Dashboard > Traffic Monitor.
The Traffic Monitor page appears, with All logs selected.
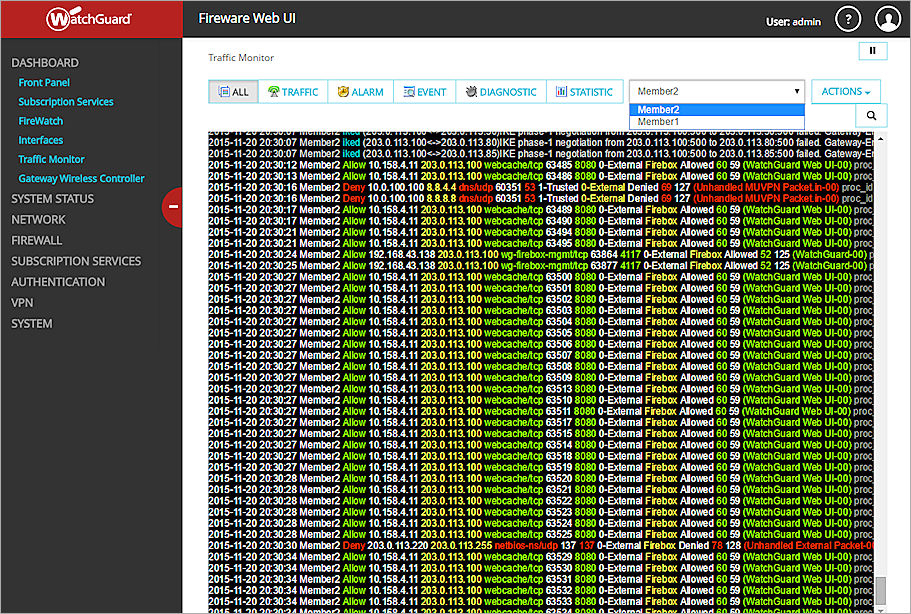
If you connect to a FireCluster, the Traffic Monitor page includes a drop-down list to select which cluster member log messages to view.
To choose which cluster member to see on the Traffic Monitor page:
From the Member drop-down list, select a cluster member.
Sort and Filter Traffic Monitor Log Messages
You can use the Traffic Monitor buttons to sort the information that you see in the Traffic Monitor. When you select a button, Traffic Monitor shows only log messages of the type you selected. You can also use the filter text box to search the log messages and refine the data you see in Traffic Monitor.
To sort by message type, click a button:
-
 — All Logs
 -
 — Traffic Logs
 -
 — Alarm Logs
 -
 — Event Logs
 -
 — Diagnostic Logs
 -
 — Performance Statistics Logs
To filter log messages by specified details:
- In the filter text box at the top of the page, type or select the information to search on.
You can type any value in the filter text box, or select a value from the drop-down list. - To remove the filter, click
 .
.
Change the Display
You can select whether the messages in the display appear in black and white, or in color. You can also select all the messages in the display or clear all the messages from the display.
- Click
 or Actions.
The button label changes from an icon to text based on the width of your browser window.
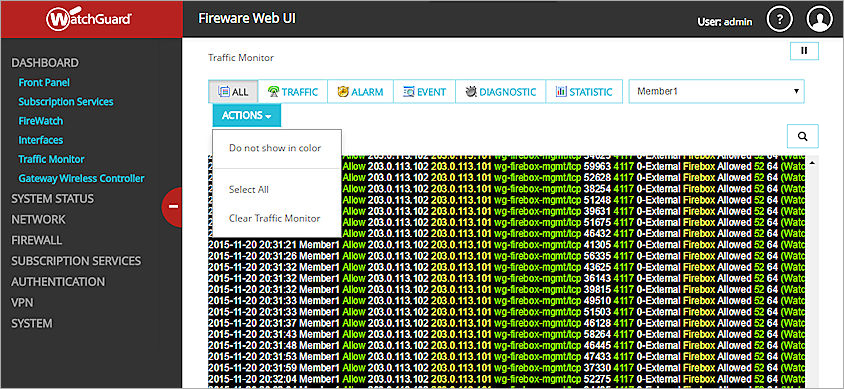
- To change the color of the display, select an option:
- Do not show in color
- Show logs in color
- To select all the log messages in the display, select Select All.
- To clear all the log messages in the display, select Clear Traffic Monitor.
Pause and Restart the Display
From Traffic Monitor, you can pause and restart the display of traffic in Traffic Monitor.
- To pause the display of traffic, click
 .
. - To start the display of traffic again, click
 .
.
View APT Threat Information
If log messages from APT Blocker appear in Traffic Monitor, you can review the threat information to see more details about the threat.
For more information, see View APT Threat Information.