
Related Topics
Front Panel
On the Front Panel page, you can see basic information about your Firebox, connected servers, your network, and network traffic.
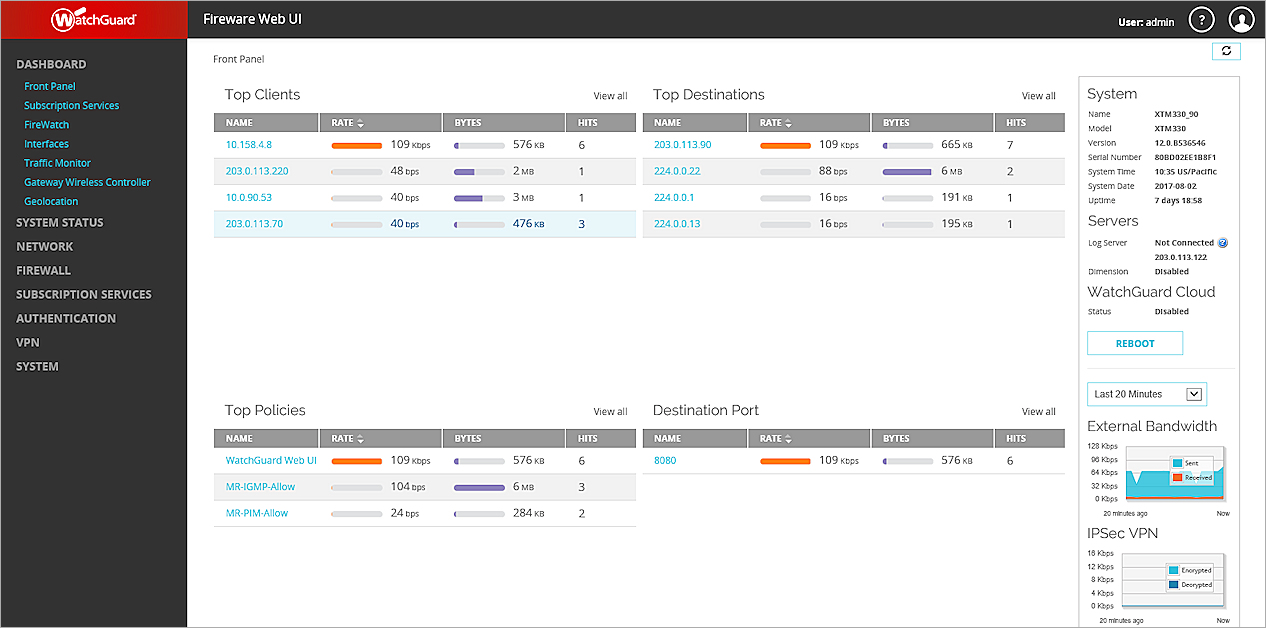
The Front Panel page is separated into two parts: widgets and top panels. Widgets show specific, historical information about your device. Top panels show connection data for your device. The page is refreshed every 30 seconds.
The Top Panels section contains real-time statistics and represents the current live data connections.
Widgets
The System, Servers, External Bandwidth, IPSec VPN, CPU, and Memory widgets refresh at the interval you specify to show you the historical information about your device. To get the most recent data, select Last 20 Minutes.
- System — This widget includes the device name, model, and serial number; the Fireware OS version on the Firebox; the system time, date, and uptime since the last restart; the IP addresses of the Log Servers where the Firebox sends log messages; the IP address of the instance of Dimension that manages this Firebox; and the number of Fault Reports available for the device.
If you logged in with a user account that has Device Administrator privileges, you can also click Reboot to reboot the Firebox. - Servers — Indicates the status of external WatchGuard server connections for Log Server, Dimension, and Threat Detection and Response (TDR).
- WatchGuard Cloud — Indicates the status of the connection to WatchGuard Cloud. For more information, see WatchGuard Cloud on your Firebox.
- IPSec VPN — This widget graph shows the usage statistics for IPSec VPN connections through your Firebox.
- External Bandwidth — This widget graph shows real-time throughput statistics for all the device interfaces in kilobytes. The Y axis (vertical) shows the cumulative throughput value of kilobytes sent and received over an interface since the last time the device was powered on or rebooted. The X axis (horizontal) shows the time interval included in the graph.
- CPU — This widget graph shows CPU usage and average load over the selected period of time.
- Memory — This widget graph shows the usage of Linux kernel memory over a period of time.
Top Panels
From the Top Panels, you can see real-time data about the currently active connections through your Firebox . Each panel shows the connection rate, number of bytes transferred through the connection, and the number of hits.
The Top Panel statistics are real-time statistics and represent the current live data connections.
The available top panels include:
- Top Clients — Shows a list of the clients connected to the Firebox that use the most bandwidth.
- Top Destinations — Shows a list of the most frequently visited destinations for current connections.
- Top Policies — Shows a list of the policies that currently manage the most traffic.
- Destination Port — Shows a list of the most frequently used ports for current connections to the Firebox.
The Rate column displays the current rate of passing data. The Bytes column indicates the total byte count for all existing connections for that host. This is cumulative for all existing open connections.
To see more details about any of the information in a top panel, or to pivot on the details in a top panel, click a detail in a top panel list. The information in the top panels is updated based on the new selection.