
Related Topics
Traffic and Performance Statistics (Status Report)
The Status Report tab shows statistics about Firebox traffic and performance. You can use the Status Report to troubleshoot problems with your configuration. You can also download a support log message file with the log data, packet trace information, and other system information the Firebox collects.
For more information about how to download the support log message file, see Download the Diagnostic Log Message File.
When you review the sections of the Status Report, some of the sections might be truncated, so not all information is available for review.
To see the Status Report:
- Start Firebox System Manager.
- Select the Status Report tab.
The Status Report appears.
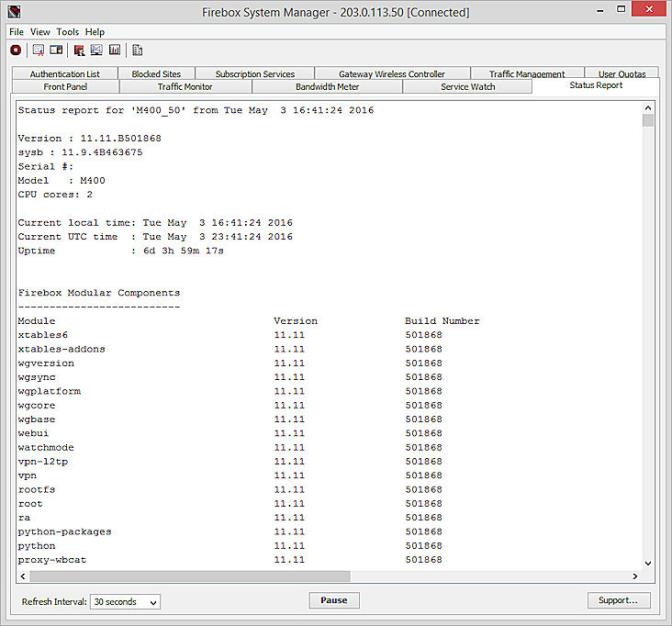
The Status Report includes this information:
Uptime and version information
Firebox uptime, the Firebox system software version, the Firebox model, OS version, and patch, if applicable. There is also a list of the status and version of the product modular components on the Firebox.
Log Servers
IP addresses of all configured Log Servers.
Logging options
Log message options that are configured with the Quick Setup Wizard or Policy Manager.
Process list
Process ID, the name of the process, and the status of the process.
Memory and load average
Statistics on the memory use (shown in bytes of memory) and load average of the Firebox. The load average has three values that typically show an average over the last minute, 5 minutes, and 15 minutes. Values over 1.00 (100%) indicate some threads are queued until resources are available. (A system load that exceeds 1.00 does not mean the system is overloaded.)
IPv6 network hop limit
The hop limit specified in your configuration for IPv6 connections to your network. The hop limit is the number of network segments a packet can travel over before it is discarded by the Firebox.
Status of PoE ports
The current status of the PoE ports configured on the Firebox. If your Firebox does not have PoE ports configured, No PoE ports appears in this section.
Network configuration
Information about the network cards in the Firebox: the interface name, its hardware and software addresses, and its netmask. The display also includes local routing information, IP aliases, and reserved DHCP leases.
Blocked Sites list, Blocked Sites exceptions
Current manually blocked sites and any current exceptions. Temporarily blocked site entries appear on the permanent Blocked Sites tab.
Interfaces
Each Firebox interface is included, with information about the interface type configuration (external, trusted, or optional), interface status, and packet count. For active trusted or optional interfaces, if IPv6 has been enabled for the interface, both the IPv4 and IPv6 address information is included.
For more information about IPv6, see About IPv6 Support.
IPv4 Routes
The IPv4 Routes section includes this information for the first 100 IPv4 routes:
- Destination — The destination IP address for the route
- Gateway — The IP address of the gateway the route uses.
- Genmask — The subnet mask for the destination IP address
- Flags — Route flags that indicate characteristics of the route.
- Metric — The routing metric, or cost for the route. A lower number indicates a lower cost and higher route priority.
- Interface — The interface to which packets for this route will be sent. For example, eth0 for interface 0.
This information appears for IPv4 static, dynamic, connected, and BOVPN virtual interface routes.
For more information about IPv4 routes, see Read the Firebox Route Tables.
IPv6 Routes
The IPv6 Routes section includes this information for the first 100 IPv6 routes:
- Destination — The destination IP address for the route
- Next Hop — The IP address of the next hop for the route.
- Flags — Route flags that indicate characteristics of the route.
- Metric — The routing metric, or cost for the route. A lower number indicates a lower cost and higher route priority.
- Interface — The interface to which packets for this route will be sent. For example, eth0 for interface 0.
This information appears for IPv6 static, dynamic, connected, and BOVPN virtual interface routes.
For more information about IPv6 routes, see Read the Firebox Route Tables.
ARP table
ARP table on the Firebox. The ARP table is used to match IP addresses to hardware addresses. (When a device is in drop-in mode, use the contents of the ARP table only to troubleshoot connectivity over secondary networks on the interfaces.)
DHCP leases
Information on DHCP client leases on the Firebox. The DHCP lease time is the UTC time listed at the start of the report.
DHCPv6 and DHCPv6 Prefix leases
If you have enabled DHCP for a trusted or optional interface that uses an IPv6 address, information about the leases for those interfaces appears in these sections.
Domain Name Servers
Address information for DNS servers.
DNS Forwarding
Domain servers and interfaces that listen for DNS forwarding requests.
Dynamic Routing
Dynamic routing components in use on the Firebox, if any.
Routing Protocol s
Contains routing statistics for these protocols: RIP, OSPF, BGP, RIPng, and OSPFv3.
Multicast Routing
Statistics about multicast routing on your Firebox.
Run-time IPSec Routes
Statistics on run-time IPSec routes, if any.
Multi-WAN status
Information on gateways and sticky connections. This section also includes the sticky connections table.
Proxy Connection Statistics
Information on enabled proxies and their connection statistics.
FireCluster details
If the Firebox is a member of a FireCluster, information about the FireCluster appears in these sections. Details include a snapshot of the cluster, cluster health information, dynamic routing specifics, HA events, and load balance details.
System Health
The current status of all the active modules on your device.
WatchGuard Cloud Status
View the status of the Firebox connection to WatchGuard Cloud.
Refresh interval
The rate at which information is updated on this display.
Support
If you are troubleshooting issues with the help of your support representative, you can click Support to create a support.tgz file to send to WatchGuard to help resolve the issues. You can also manage the Fault Reports on your device and send them to WatchGuard.
Search the Status Report for Specific Details
You can use the find feature to search for specific text strings in the Status Report.
From the Status Report tab:
- Press Ctrl+F on your keyboard.
The Find bar appears.
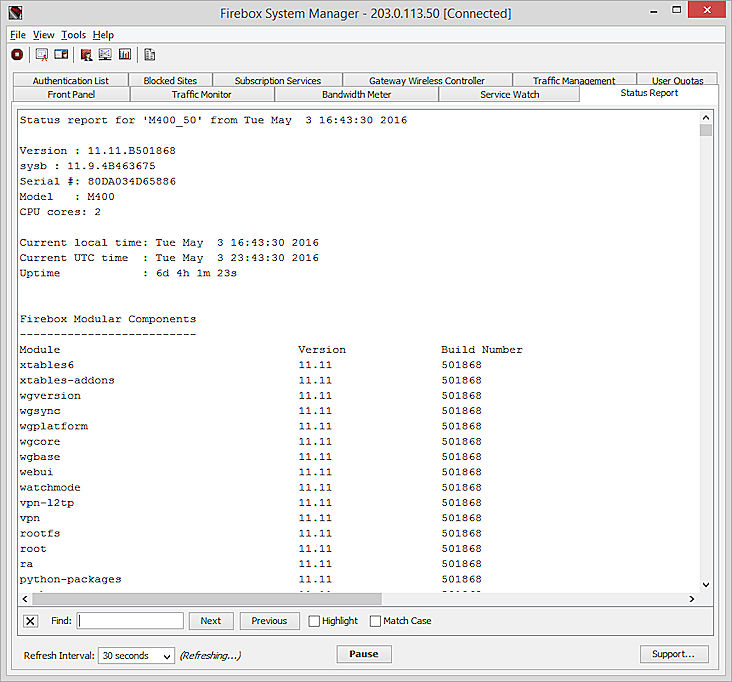
- In the Find text box, type the text string to search for in the Status Report.
As soon as you start typing, the Find feature searches for the text you type. - To run a case sensitive search, select the Match Case check box.
- To search forward in the Status Report for another instance of the specified text, click Next.
- To search backward in the Status Report for another instance of the specified text, click Previous.
- To highlight all instances of the specified text in the Status Report, select the Highlight check box.
- To close the Find bar, click
 .
.
Change the Refresh Interval
The content of the Status Report updates automatically according to the refresh interval you specify.
To change the refresh interval:
- From the Refresh Interval drop-down list, select a different interval.
- To stop the automatic refresh of the display, click Pause.
While the display is paused, it does not refresh at the selected interval. - To start the automatic display refresh again, click Continue.
The display is refreshed immediately and then at to the selected refresh interval.
Download the Diagnostic Log Message File
Your Firebox collects log data and other system information that is helpful when you troubleshoot system problems with a WatchGuard Technical Support representative. You can download this information from your Firebox in a diagnostic log message file (support.tgz) that you can send to your Technical Support representative.
Before you download the diagnostic log message file, make sure to enable diagnostic logging on your Firebox. For more information about how to enable diagnostic logging, see Set the Diagnostic Log Level.
To download the diagnostic log file:
- Start Firebox System Manager.
- Select the Status Report tab.
- Click Support.
The Support Files dialog box appears. Firebox System Manager gets the log data and system information from the Firebox.
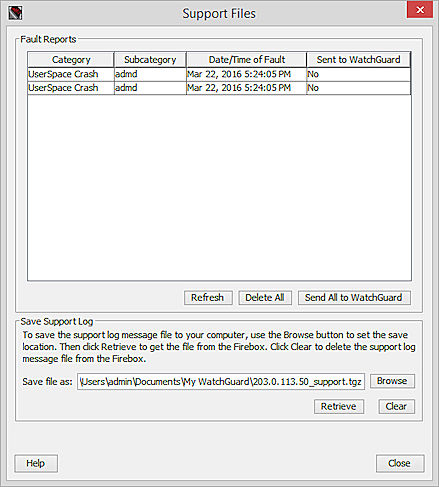
- To select the location to save the diagnostic log files, click Browse.
Support log files are saved in tarzipped (*.tgz) format. - Click Retrieve.
The support.tgz file is saved to the specified location. - Send the support.tgz file to your WatchGuard Technical Support representative for review.
- Disable diagnostic logging.
Your Technical Support representative might also suggest you send any Fault Reports on your Firebox to WatchGuard for review. For more information about Fault Reports and how to send them, see Manage Fault Reports.
Delete the Diagnostic Log Message File
After you have downloaded the diagnostic log message file, you can delete the file from your Firebox. If there are Fault Reports on your Firebox, the Fault Reports are deleted at the same time.
- In the Save Support Log section, click Clear.
The Clear Logs dialog box appears. - Click Yes.
The diagnostic log message file and Fault Reports are removed from your Firebox.
Save the Status Report
You can select parts of the text in the Status Report and copy it to another file, or you can select to save the entire report to a text file.
To save selected parts of the report:
- Use your cursor to highlight the text.
Or, right-click the report and select Select All. - Right-click the highlighted text and click Copy.
- Paste the text you copied in another file.
To save the entire report:
- Right-click the report and select Save Status Report to File.
The Save As dialog box appears. - Specify a descriptive name for the report to help you identify it.
- Select a location where you can locate the report for later use.
- Click Save.
See Also
Monitor your Firebox with Firebox System Manager (FSM)