Applies To: WatchGuard Cloud-managed Access Points (AP130, AP230W, AP330, AP332CR, AP340, AP430CR, AP432)
You can view the status of your access point network interfaces in WatchGuard Cloud.
Most access points have a single LAN interface, but some access point models have multiple interfaces that you can configure. For more information, go to Configure Access Point Network Interface Settings.
To monitor the network interfaces of your access point:
- Select Monitor > Devices.
- Select an access point or a folder that contains your access points.
- Select Live Status > Interfaces.
The Interfaces page opens.
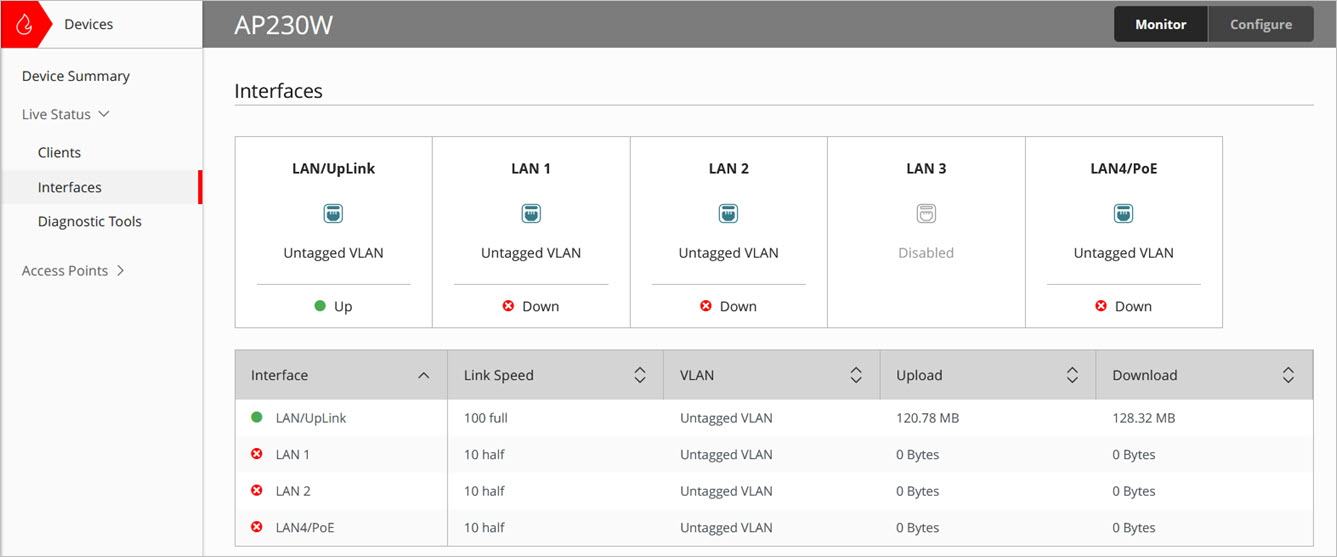
The Interfaces page for a specific access point includes this data:
- Interfaces — The status and name of the interface. Some access point models have multiple interfaces and include uplink and additional LAN interfaces.
- Link Speed — The detected link speed of the connection. For example, 1000 full or 10 half duplex. If the interface is enabled but disconnected, the Link Speed will show as Unknown.
- VLAN — The VLAN ID of the interface if you configured tagged VLANs for your network interfaces. If there are no tagged VLANs configured, this shows Untagged VLAN.
- Upload — The total amount of data uploaded by the interface.
- Download — The total amount of data downloaded by the interface.
Click the interface drop down to expand the view and show additional live data about network interface traffic issues:
- Date-Time — Date and time the interface statistics were last recorded.
- Errors — Total number of packets that could not be processed successfully due to transmission or reception errors.
- Frame Errors — Packets received with an invalid frame format, such as damaged headers or incorrect frame structure.
- Collisions — Number of packet transmission collisions detected on the network segment. This primarily occurs on half-duplex Ethernet links.
- Overruns — Packets that could not be processed because the interface or hardware buffer was full and incoming data arrived too quickly.
- Carrier — Carrier-sense or link-related errors that indicate problems detecting or maintaining the physical network connection.
- Dropped Packets — Packets discarded by the interface before they could be transmitted or processed, typically due to buffer limitations, congestion, or resource constraints.
The Interfaces page for a folder of multiple access points includes this data:

- Access Point — The name of the access point. Click the name for more detailed information about the access point interfaces.
- Up — Indicates the interfaces that are current up and sending and receiving traffic.
- Down — Indicates the interfaces that are currently down and not sending or receiving traffic.
- Disabled — Indicates network interfaces that are disabled.
- Link Speed — The detected link speed of the connection. For example, 1000 full or 10 half duplex. If the interface is enabled but disconnected, the Link Speed will show as Unknown.
Configure Access Point Network Interface Settings
Access Point Network Usage Report