Applies To: Cloud-managed Fireboxes, Locally-managed Fireboxes
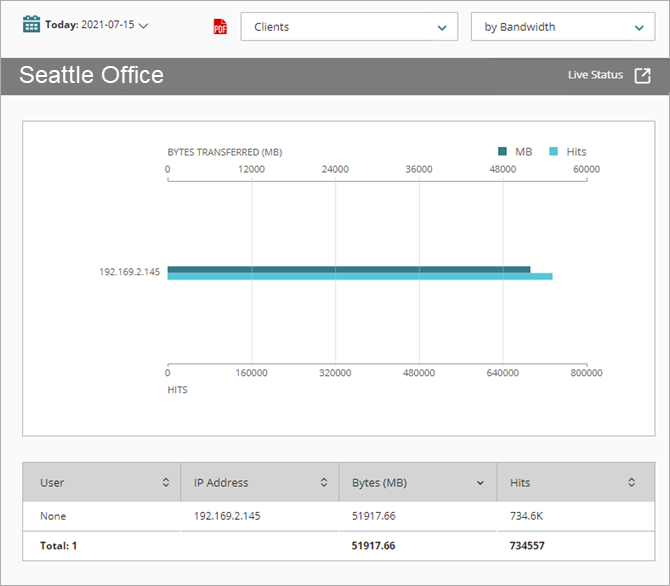
The Most Active Clients report displays a summary of the top web traffic for clients, by hits and bytes transferred. The report only includes data for traffic handled by the HTTP and HTTPS proxies.
This report includes data for HTTPS traffic in Dimension v2.1.2 Update 2 or higher.
This report is available when log messages with data for this report exist in the specified time frame. To make sure that your Firebox sends log messages required to generate this report, follow the steps to Enable Logging for this Report.
How to Use this Report
This report can help you to see the clients responsible for the most web traffic on your network.
- Select the Bandwidth pivot to see which clients use the most bandwidth for web traffic on your network. A high number of bytes transferred could indicate that the client downloads or streams a large amount of content from the Internet.
View the Report
This report is available in WatchGuard Cloud and in Dimension.
- Log in to WatchGuard Cloud.
- Select Monitor > Devices.
- Select a folder or a specific device.
- To select the report date range, click
 .
.
- From the list of reports, select Web > Most Active Clients.
- To see reports for your Fireboxes or FireClusters, select Home > Devices.
The Devices list opens.
To see reports for your groups of Fireboxes, select Home > Groups.
The Groups list opens. - Select the Name of a Firebox, cluster, or group.
The Tools > Executive Dashboard page opens. - Select the Reports tab.
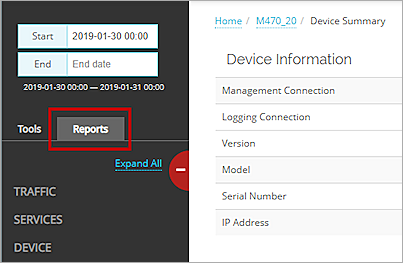
- Select Web > Most Active Clients.
The Most Active Clients report opens.
Pivots
You can use pivots to change the view of the data on the report.
To switch to a different view, select a pivot from the drop-down list above the report.
This report includes these pivots:
Hits
Summary of the top web traffic for clients by hits.
Bandwidth
Summary of the top web traffic for clients by bytes of data transferred.
Detail View
Detail view is not available for this report.
Enable Logging for this Report
Logging for cloud-managed Fireboxes is automatically enabled. For locally-managed Fireboxes, you must manually enable logging in Fireware Web UI or Policy Manager. For more information, see Set Logging and Notification Preferences.
To collect the data required for this report for locally-managed Fireboxes, in Fireware Web UI or Policy Manager:
- In the General Settings for all HTTP and HTTPS proxy actions, select Enable logging for reports. For more information, see HTTP Request: General Settings and HTTPS-Proxy: General Settings.