Applies To: Locally-managed Fireboxes
The Data Loss Violations (DLP) report shows a summary of data loss violations on your network and the actions taken by Data Loss Prevention.
This report is available when log messages with data for this report exist in the specified time frame. To make sure that your Firebox sends log messages required to generate this report, follow the steps to Enable Logging for this Report.
How to Use this Report
This report can help you to identify how data loss violations occur on your network. Here are some ways to use this report:
- Select the Activity Trend pivot to see the number of data loss violations allowed, denied, and quarantined compared to the total files scanned.
- Select the Sender/Source pivot to identify the most common sources of data loss violations on your network.
- In an audit, use the report data to demonstrate compliance with rules or regulations that require you not to allow sensitive data to leave your network.
- Use the data on the report to fine tune your Data Loss Prevention rules. For example, if the Rules pivot shows a large number of allowed violations, you might want to change the actions in some DLP Sensors.
View the Report
This report is available in WatchGuard Cloud and in Dimension.
- Log in to WatchGuard Cloud.
- Select Monitor > Devices.
- Select a folder or a specific device.
- To select the report date range, click
 .
.
- from the list of reports, select Services > Data Loss Violations (DLP).
The Data Loss Violations report opens.
- To see reports for your Fireboxes or FireClusters, select Home > Devices.
The Devices list opens.
To see reports for your groups of Fireboxes, select Home > Groups.
The Groups list opens. - Select the Name of a Firebox, cluster, or group.
The Tools > Executive Dashboard page opens. - Select the Reports tab.
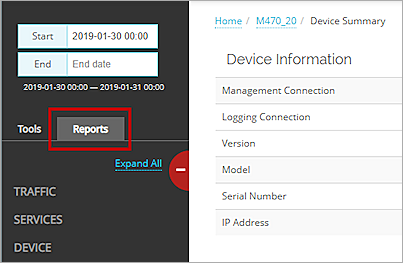
- Select Services > Data Loss Violations (DLP).
The Data Loss Violations report opens.
Pivots
You can use pivots to change the view of the data on the report.
To switch to a different view, select a pivot from the drop-down list above the report.
This report includes these pivots:
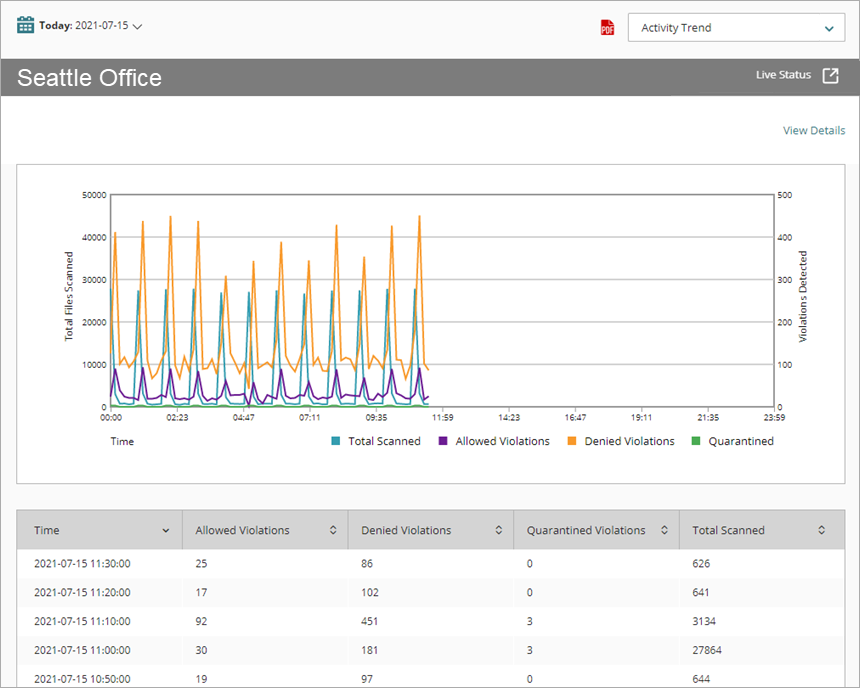
Activity Trend
Summary of the traffic scanned by Data Loss Prevention. Data includes the total number of scans, the allowed violations, denied violations, and quarantined violations.
Sender/Source
Summary of the detected violations by the sender or source address.
Recipient/Destination
Summary of the detected violations by the recipient or destination address.
Rules
Summary of the detected violations by rule name.
Data Loss Violations (DLP) Report Detail View
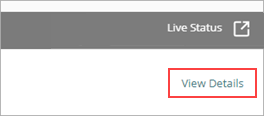
To view a detailed report of all data loss violations detected by DLP, click the View Details link at the top of the report.
The Data Loss Violations (DLP) Detail report includes a row for each connection that included a data violation:
| Column | Description |
|---|---|
| Disposition | Action taken by the Firebox for this traffic, such as Stripped or Allowed |
| Date-Time | Date and time that the event occurred |
| Rule Name | Name of the Data Loss Prevention content control rule that the data matched |
| User | Name of the user who sent the traffic If authentication is not enabled, None appears in this column |
| Sender | For SMTP protocol, the email address the email was sent from |
| Recipient | For SMTP protocol, the email address the email was sent to |
| Source IP | IP address of the traffic source |
| Dest IP | IP address of the traffic destination |
| Protocol | Protocol used to send the traffic |
| Policy | Name of the Firebox policy that examined the traffic |
| Violations | Number of data violations |
Enable Logging for this Report
Logging for cloud-managed Fireboxes is automatically enabled. For locally-managed Fireboxes, you must manually enable logging in Fireware Web UI or Policy Manager. For more information, see Set Logging and Notification Preferences.
To collect the data required for this report for locally-managed Fireboxes, in Fireware Web UI or Policy Manager:
- In the General Settings of all proxy actions that use Data Loss Prevention, select Enable logging for reports.
- In all DLP Sensor Actions, select the Log check box. For more information, see Configure DLP Sensors.