Applies To: Locally-managed Fireboxes
In WatchGuard Cloud, FireWatch is a real-time, interactive report tool that groups, aggregates, and filters statistics about the traffic through your Firebox in an easy-to-understand form. FireWatch includes many options to pivot, refine, and filter information about your firewall traffic. Some of the information you can see includes:
- Top Users
- Top Domains
- Application Usage
- Bandwidth Usage
- Firewall Traffic
- Security Service Activity
- Device State
You can use FireWatch to see:
- Who uses the most bandwidth on your network
- Which is the most popular site that users visit
- Which sites use the most bandwidth
- Which applications use the most bandwidth
- Which sites a particular user visited
- Which applications are most used by a specific user
The FireWatch page is separated into tabs of data that is presented in a Treemap Visualization. The treemap proportionally sizes blocks in the display to represent the data for that tab. The largest blocks on the tab represent the largest data users. The data is sorted by the tab you select and you can pivot the data on the Bytes or Connections.
FireWatch includes these tabs:
Source
On the Source tab, you can see all the user and host addresses where connection through the Firebox originate. Source information shows in the treemap in blue.
Destination
On the Destination tab, you can see all the addresses where the connections through the device terminate. Destination information shows in the treemap in blue.
Domains
On the Domains tab, you can see all the domains visited over the selected time range. Domain names are aggregated from the visited host names. For example, google.com shows for traffic to gmail.google.com. Domain information shows in the treemap in blue.
Application
On the Application tab, you can see an aggregate view of all the applications currently in use. Application information shows in the treemap in green.
Web Audit
On the Web Audit tab, you can see all the WebBlocker categories in use over the selected time range. You can view the data based on the number of connections only. Web Audit information shows in the treemap in green.
Protocol
On the Protocol tab, you can see an aggregate view of all the protocols in use over the specified time range. Protocol information shows in purple.
If this dashboard is not available for your device, follow the steps to Enable Logging for this Dashboard.
See Connection Details
On any FireWatch tab, you can see detailed information for any active connection. The number of active connections for the data type you select display at the top right of the FireWatch page, next to the data type drop-down list.
To see details for active connections to your Firebox, from WatchGuard Cloud:
- Log in to WatchGuard Cloud.
- Select Monitor > Devices.
- Select a folder or a specific device.
- To select the report date range, click
 .
.
- From the list of reports, select Dashboards > Firewatch.
The FireWatch page opens. - Select a tab.
The current connections open.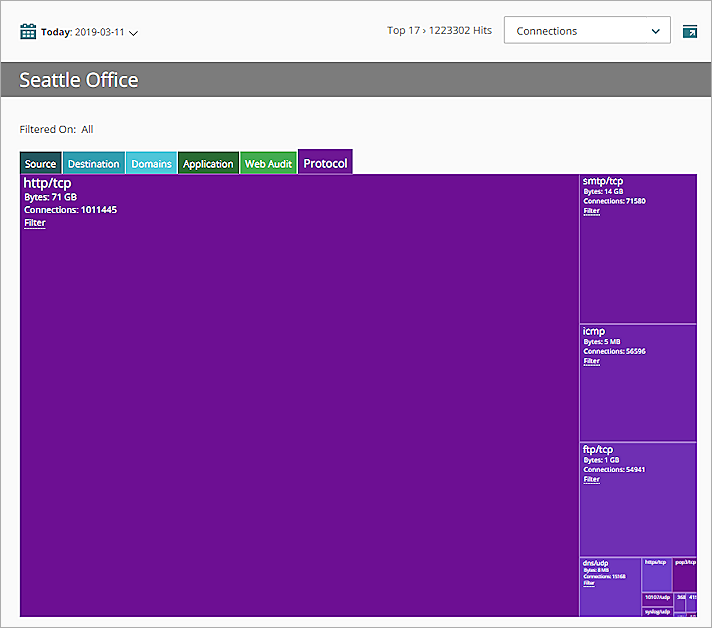
- To show data for a specific time period:
- Above the dashboard, click the currently selected time period.
A drop-down list opens. - Select a predefined period from the list or select Custom and specify a custom time period. For more information, see Filter Reports and Dashboards by Date.
Data displays for the time range you specified.
- Above the dashboard, click the currently selected time period.
- To change the type of data that shows in the selected tab, from the drop-down list at the top right of the page, select an option:
- Bytes
- Connections
- To see details about any item in the treemap, place your cursor over the item.
The connection details dialog box opens.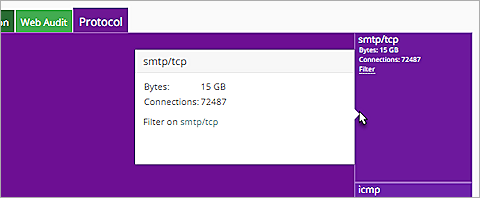
- To filter the information that shows in the treemap by a selected connection, in the connection details dialog box, click the IP address, domain name, application, category, or protocol of the connection.
Or, in the item on the main FireWatch page, click Filter.
The treemap data is updated based on the selected filter.
Not all options are available for all connection types.
The data in the display is updated based on the option you selected.
View FireWatch in Full Screen Mode
When there are many active connections, it can be helpful to see a larger view of the FireWatch page. You can use the Full Screen mode to expand your web browser view of FireWatch.
In Full Screen mode, the FireWatch tabs disappear, and the data from each tab shows as a group. Firewatch displays data for each group in sequence. You can select which groups to include in the display, specify how often the page refreshes, and select filters.
Firewatch shows data in bytes for all groups except Web Audit, which shows the number of connections. If byte counts are unavailable, information appears in number of connections.
To enable Full Screen mode:
- At the top of the FireWatch page, click
 .
.
The FireWatch page expands to full screen.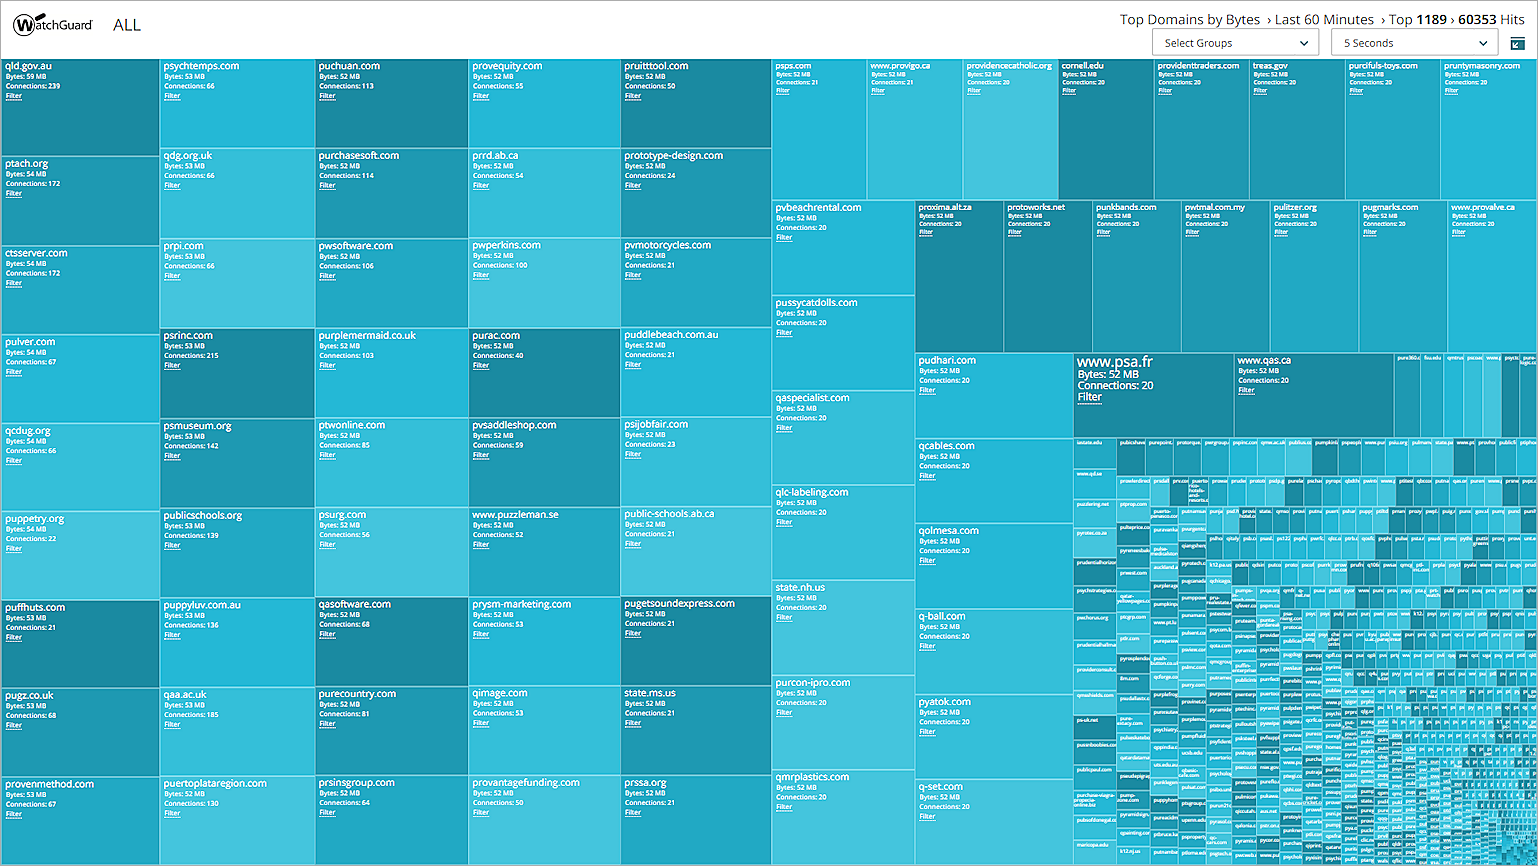
- To change which data shows, from the Select Groups drop-down list, select the check box for each group to include in the Full Screen mode view:
- Source
- Destination
- Application
- Domains
- Web Audit
- Protocol
- To specify the FireWatch page refresh rate, select an option from the second drop-down list:
- 5 seconds
- 10 seconds
- 15 seconds (Default)
- 30 seconds
- 60 seconds
To disable Full Screen mode:
- Click
 .
. - Press Esc on your keyboard.
Enable Logging for this Dashboard
Logging for cloud-managed Fireboxes is automatically enabled. For locally-managed Fireboxes, you must manually enable logging in Fireware Web UI or Policy Manager. For more information, see Set Logging and Notification Preferences.
To collect the data required for this report for locally-managed Fireboxes, in Fireware Web UI or Policy Manager:
- In the Logging and Notification settings for all packet filters, select Send a log message for reports. For more information, see Set Logging and Notification Preferences.
- In the General Settings for all proxy actions, select Enable logging for reports.
- In all WebBlocker actions, select the Log check box for all categories and select the When a URL is uncategorized, Log this action check box. For more information, see Configure WebBlocker Categories.