Applies To: Cloud-managed Fireboxes, Locally-managed Fireboxes
On the Executive Dashboard page in WatchGuard Cloud, you can see a high-level view of the traffic through the selected device. The Executive Dashboard includes these categories:
- Top Countries
- Top Clients
- Top Domains
- Top URL Categories
- Top Destinations
- Top Applications
- Top Application Categories
- Top Protocols
Each of these categories appears only if there is data available in that category for the selected date range.
If this dashboard is not available for your device, follow the steps to Enable Logging for this Dashboard.
See the Executive Dashboard in WatchGuard Cloud
To see the Executive Dashboard in WatchGuard Cloud:
- Log in to WatchGuard Cloud.
- Select Monitor > Devices.
- Select a folder or a specific device.
- To select the report date range, click
 .
.
-
From the list of reports, select Dashboards > Executive Dashboard.
The Executive Dashboard page opens for the selected device.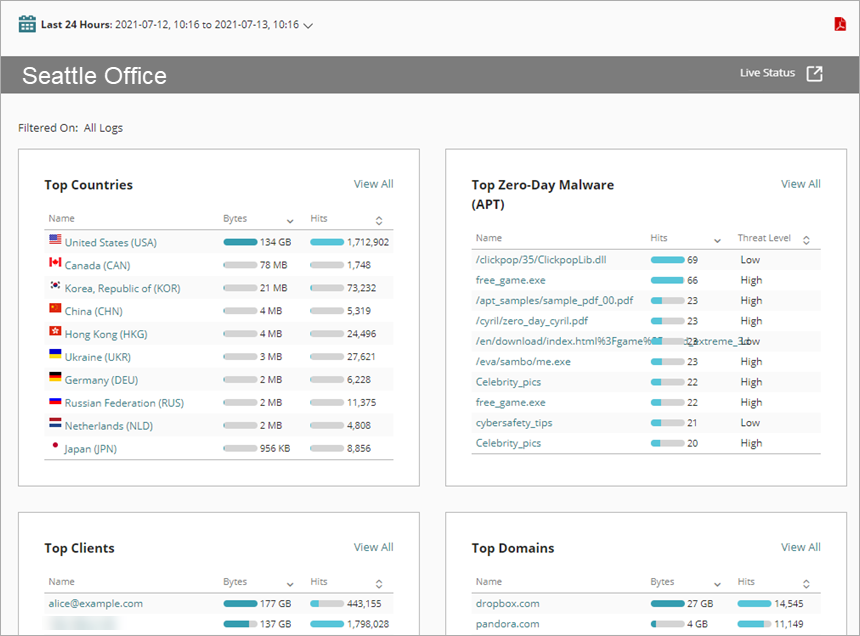
- To show data for a specific time period:
- Above the dashboard, click the currently selected time period.
A drop-down list opens. - Select a predefined period from the list or select Custom and specify a custom time period. For more information, see Filter Reports and Dashboards by Date.
The data in the Executive Dashboard changes based on the time range you specified.
- Above the dashboard, click the currently selected time period.
- To see more information about a specific item (such as an IP address, domain name, or application), click a link in the Name column.
Only data for the selected item is shown on the dashboard . - To see all data for a specific category, next to the category title, click View All.
Only data for the specified category is shown on the dashboard. - To clear a filter and show all data, click Clear.
When there is too much data to display in the Top Clients or Top Destinations tile, you are prompted to select a shorter time range.
When there is too much data in the selected time range to show, you can select a shorter time range or generate the report.
Generate the Executive Dashboard Report
You can generate a summary report in PDF format that includes information from the Executive Dashboard.
To download the Executive Dashboard report:
- Above the dashboard, click the PDF icon
 .
.
The file downloads or a confirmation message opens. - If the report does not download automatically, select to open or save the file.
Enable Logging for this Dashboard
Logging for cloud-managed Fireboxes is automatically enabled. For locally-managed Fireboxes, you must manually enable logging in Fireware Web UI or Policy Manager. For more information, see Set Logging and Notification Preferences.
To collect the data required for this report for locally-managed Fireboxes, in Fireware Web UI or Policy Manager:
- In the Logging and Notification settings for all packet filters, select Send a log message for reports. For more information, see Set Logging and Notification Preferences.
- In the General Settings for all proxy actions, select Enable logging for reports.
- In all APT Blocker actions, select the Log check boxes for threat levels. For more information, see Configure APT Blocker.
- In all WebBlocker actions, select the Log check box for all categories and select the When a URL is uncategorized, Log this action check box. For more information, see Configure WebBlocker Categories.