Applies To: Wi-Fi Cloud-managed Access Points (AP120, AP125, AP225W, AP320, AP322, AP325, AP327X, AP420)
Analyze displays analytic data about guest users who use Wi-Fi by authenticating with social media accounts. Analyze can retrieve user-specific information from the social media account and provide location-based social analytics graphs and portal-based visitor log information.
Facebook has recently implemented new compliance requirements about the storage and use of opt-in demographic profile information (age and gender) collected from guest Wi-Fi users. This data will no longer be available from the Wi-Fi Cloud-managed Facebook app, and profile information such as age and gender will appear as "Unspecified" in Analyze reports.
To view demographic analytics, click Analytics > Demographics.
The date displayed at the top of the Analytics page is the last date for which data is available.
Data is organized by these graphs:
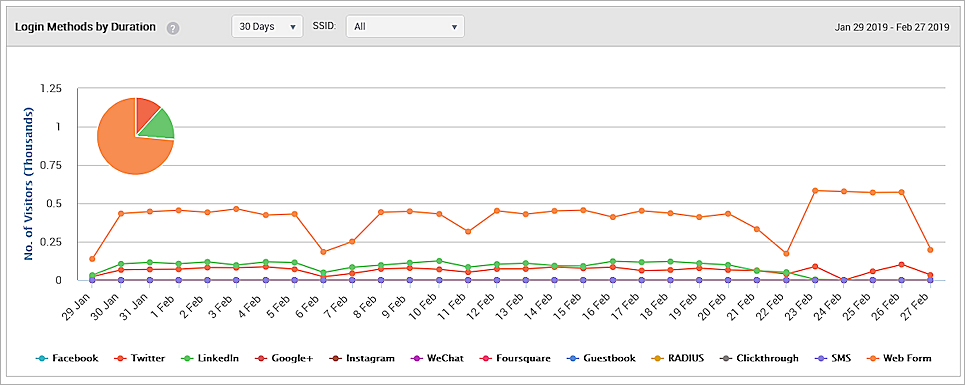
- Login Methods by Duration — A line graph that shows the login method for guests who access Wi-Fi. For the selected location, this graph shows the number of guests for each plug-in (social media, Guestbook, and click-through) during the specified duration for the selected SSID. The data is based on the date that you select. To select the date, click the date at the top of the Analytics page. A pie chart of the distribution is also displayed for the selected duration and SSID. By default, the graph and pie chart are based on last 7 days of data for all the SSIDs defined on the servers.
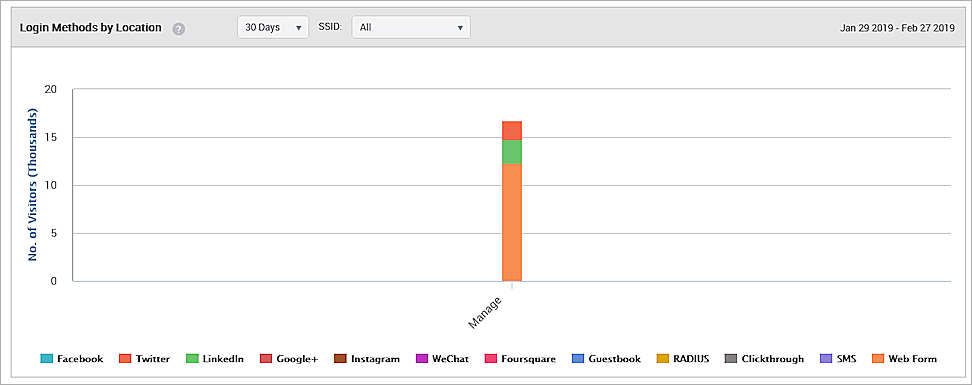
- Login Methods by Location — A bar graph that shows percentage of guests who used a particular login method for the selected location and its child locations. The data is based on guests who accessed Wi-Fi during the specified duration for the selected SSID.
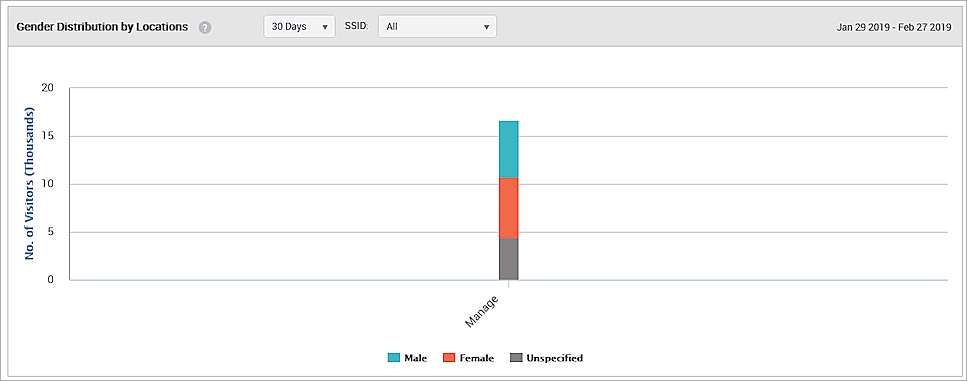
- Gender Distribution by Duration — A pie chart that shows gender statistics for guests who accessed Wi-Fi during the specified time duration for the selected SSID.
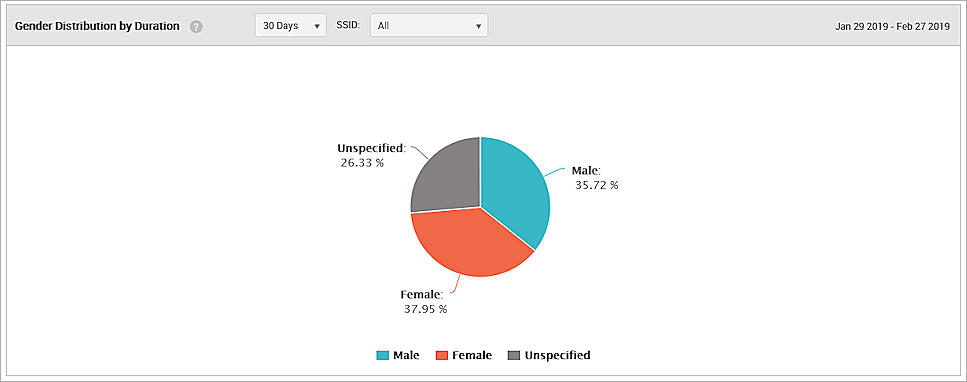
- Gender Distribution by Location — A pie chart that shows gender statistics for guests who accessed Wi-Fi at the selected location and SSID during the specified time duration.
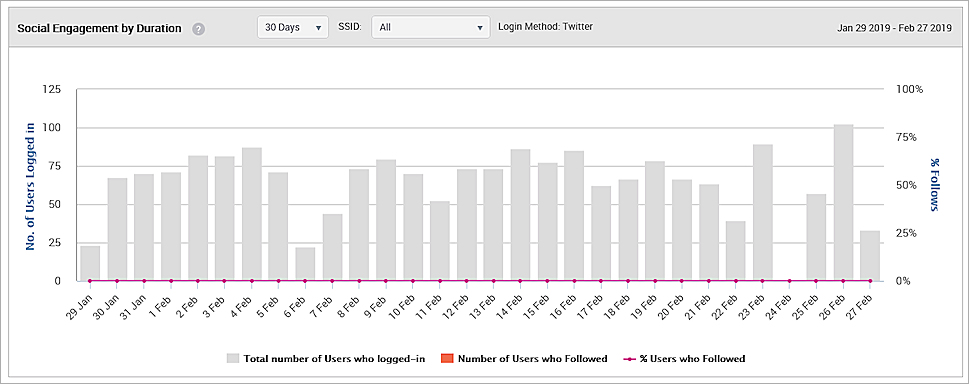
-
Social Engagement by Duration — A chart that shows the number of guest users who logged in with a Facebook or Twitter, and liked the page for the selected duration.
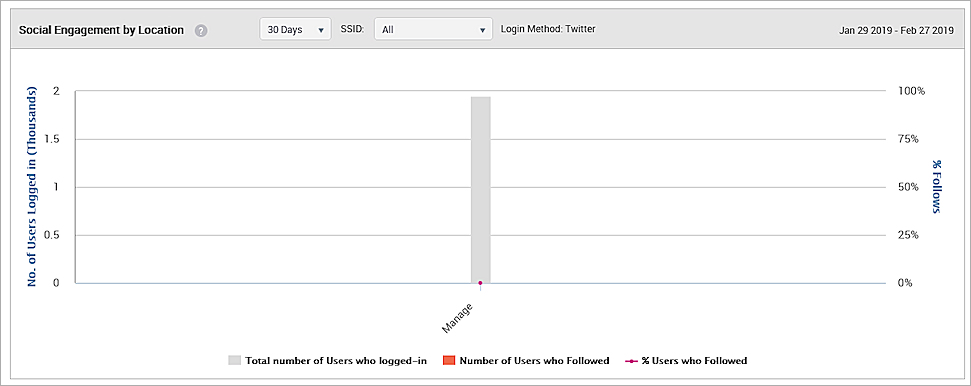
- Social Engagement by Location — A chart that shows the number of guest users who logged in with a Facebook or Twitter account, and liked the page for a selected location.
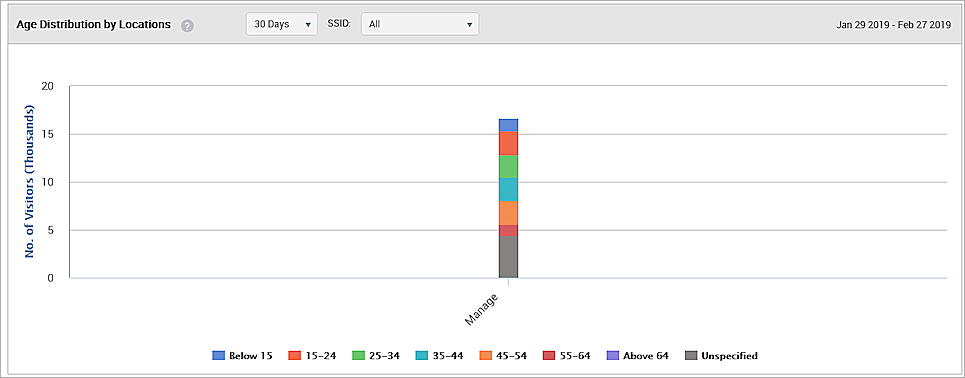
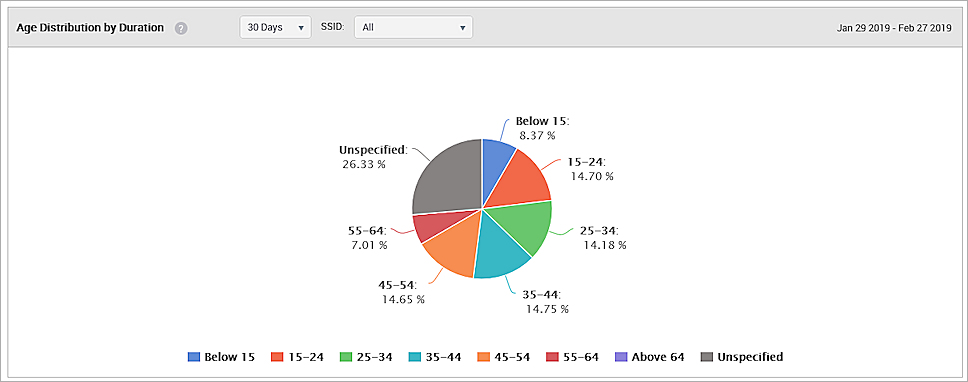
- Age Distribution by Duration — A pie chart that shows the number of guests for different age ranges who accessed Wi-Fi during the specified time duration for the selected SSID.
- Age Distribution by Location — A chart that shows the number of guests for different age ranges who accessed Wi-Fi for the selected location and its child locations.