Applies To: Cloud-managed Fireboxes, Locally-managed Fireboxes
In WatchGuard Cloud, Threat Map is a visual representation of the source and destination locations around the world for the traffic through your Firebox.
The Threat Map shows only the event types associated with the pivot you select:
- Denied Packets (Blocked) — Shows only denied events
- Blocked Botnet Sites — Only appears if botnet traffic is included in the log messages
- Intrusion Prevention Service — Shows only denied events
- Web Traffic — Shows only allowed events
- Application Control — Shows only allowed events
- All Traffic — Shows only allowed events
You can pivot on the information in the Threat Map for the source and destination IP addresses (IPv4 or IPv6), based on the view you select. The Web Traffic, Application Control, and All Traffic views use the destination IP address for the location of the traffic. The Denied Packets and Intrusion Prevention Service views use the source IP address for the location of the traffic. The Blocked Botnet Sites view shows the source and destination IP address of the botnet site.
If this dashboard is not available for your device, follow the steps to Enable Logging for this Dashboard.
See the Threat Map in WatchGuard Cloud
The colors that appear in the map indicate the number of hits in each geographical location for the selected view.
- Red — High number of denied events
- Orange — Medium number of denied events
- Yellow — Low number of denied events
- Bright green — High number of allowed events
- Light green — Medium number of allowed events
- Grey — No events
After you select an option in the Threat Map to pivot on, you can click on the details (such as a country or an IP address) to get additional information. For a country, this includes a list of protocols, cities, IP addresses, and hits. For an IP address, this includes a list of all hits, whether it is the source or the destination address, and whether the traffic was allowed or denied.
To see the Threat Map in WatchGuard Cloud:
- Log in to WatchGuard Cloud.
- Select Monitor > Devices.
- Select a folder or a specific device.
- To select the report date range, click
 .
.
-
From the list of reports, select Dashboards > Threat Map.
The Threat Map page opens.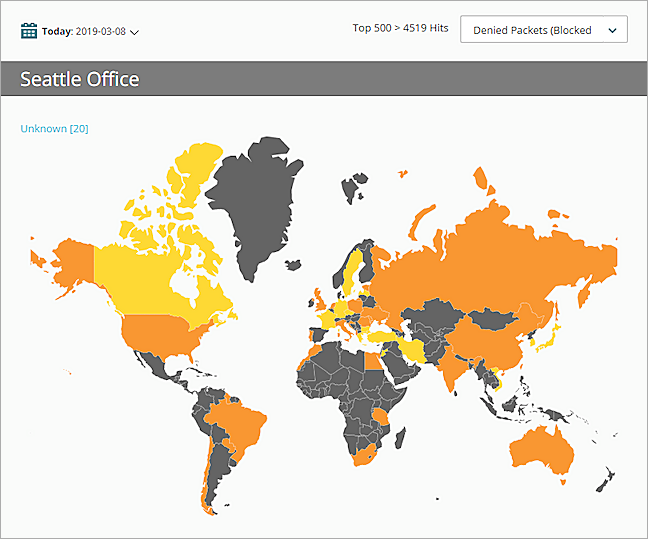
- To show data for a specific time period:
- Above the Threat Map, click the currently selected time period.
A drop-down list opens. - Select a predefined period from the list or select Custom and specify a custom time period. For more information, see Filter Reports and Dashboards by Date.
Data appears for the time range you specified.
- Above the Threat Map, click the currently selected time period.
- From the drop-down list above the Threat Map, select a pivot to reorganize the data into a different view:
- Denied Packets (Blocked)
- Blocked Botnet Sites
- Intrusion Prevention Service
- Web Traffic
- Application Control
- All Traffic
To see more information about the threats on the map:
- To see information about threats from a country, click that country on the map.
Or, to see information about IP addresses from unknown geographic locations, at the top of the map, click the Unknown link.
A list of threats appears.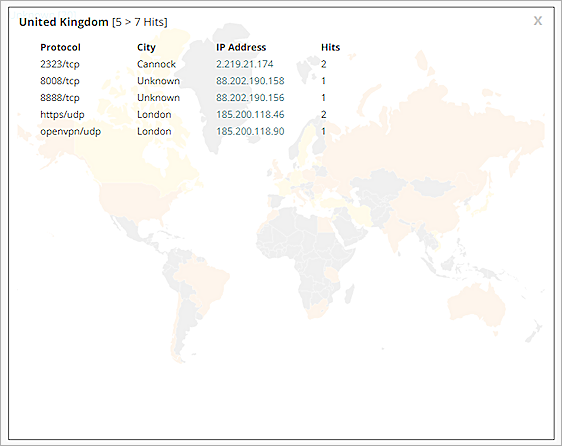
-
To see more information about a specific IP address in the list, click the IP address.
A dialog box with specific details about the traffic from the selected IP address opens.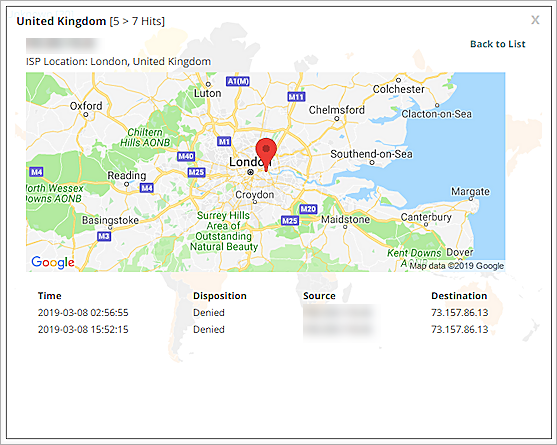
The IP address location map uses a Google API to identify the current location of an IP address. There might be inconsistencies between this data and the location data from the Firebox log messages.
For each IP address, these details show:
- Time — The date and time of the traffic to the Firebox.
- Disposition — Whether the traffic was allowed or denied.
- Source — The origination address for the traffic.
- Destination — The destination address for the traffic.
- Hits — The number of hits for the traffic.
- Additional info — Any other information for the IP address.
- To return to the list of threats for a country, click Back to List.
Enable Logging for this Dashboard
Logging for cloud-managed Fireboxes is automatically enabled. For locally-managed Fireboxes, you must manually enable logging in Fireware Web UI or Policy Manager. For more information, see Set Logging and Notification Preferences.
To collect the data required for this dashboard:
- In the Logging and Notification settings for all packet filters, select Send a log message for reports. For more information, see Set Logging and Notification Preferences.
- In the General Settings for all proxy actions, select Enable logging for reports.
- In the Intrusion Prevention settings, select the Log check box for threat levels with the Block and Drop actions. For more information, see Configure Intrusion Prevention.
- In all WebBlocker actions, select the Log check box for all categories and select the When a URL is uncategorized, Log this action check box. For more information, see Configure WebBlocker Categories.