Applies To: Cloud-managed Fireboxes, Locally-managed Fireboxes, WatchGuard Cloud-managed Access Points
In WatchGuard Cloud, you can view reports that provide insight into the network activity on your devices. Reports display details of the traffic allowed and denied by the device, the services that are enabled, and other device information.
Some reports include pivots that display different views of the report data. You can also export data from reports to a PDF or CSV file. You can customize the branding on PDF summary reports. For more information, see Add Custom Branding.
For information about the available reports, see WatchGuard Cloud Device Reports List.
View Device Reports
You can view WatchGuard Cloud device reports at the folder or device level. At the top-folder level, reports show combined data from all your devices. At the device level, reports show data for the selected device only.
To view device reports in WatchGuard Cloud:
- Log in to WatchGuard Cloud.
- Select Monitor > Devices.
- Select a folder or a specific device.
- To select the report date range, click
 .
.
- From the list of reports, select a report.
The selected report data opens.
Filter Reports and Dashboards by Date
WatchGuard Cloud reports and dashboards display data for the current date by default. To view data for a different time period, you can select a predefined period or specify a custom date range.
When you change the time period for a report or dashboard, that time period is used to filter data in all other reports and dashboards you view until you change it.
Reports and dashboards only show data from the time period covered by the Data Retention License for a device. The system time on the Firebox that you want to generate reports for must be less than 8 hours from the current time. If the local Firebox time is more than 8 hours from the current time, WatchGuard Cloud does not accept the logs to generate the report.
- Above the report or dashboard, click the currently selected time period.
A drop-down list opens.

- Select a predefined period from the list.
- Above the report or dashboard, click or the currently selected time period.
A drop-down list opens. - Select Custom.
A dialog box opens.
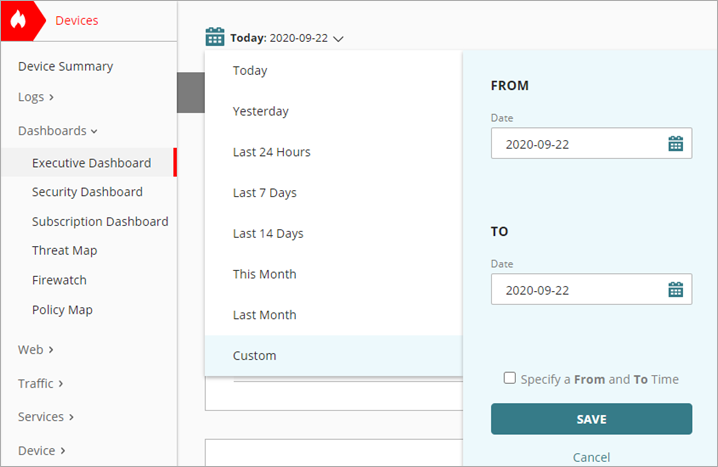
- In the Date text boxes, type the start and end dates for the data, or select dates from the calendars.
- To display data for a specific time range:
- Select the Specify a From and To Time check box.
- In the Time text boxes, type the start and end times for the data, in 24-hour format (for example, 23:59), or drag the Hours and Minutes sliders to select times.
- Click Save.
For graphs that show data over time, you can zoom in to see a smaller data set.
To zoom in, put your mouse cursor over the graph, hold down the left mouse button, and drag the cursor to select a time range.
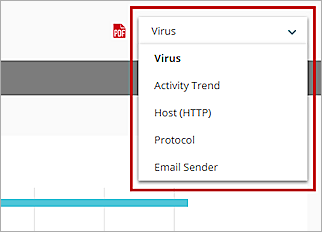
View Pivots
Some reports include pivots to reorganize the report data into a different view. For example, some Web reports include pivots to display report data by number of hits or by total bandwidth used.
To switch to a different view, select a pivot from the drop-down list above the report.
View Detail Reports
Detail reports provide a detailed view of the data from another report. Detail reports display report data in a table that you can export to a CSV file.
To view a detail report:
- In the list of reports, select Detail and then select a report name.
Or, click View Details at the top of a summary report.
The Detail report opens.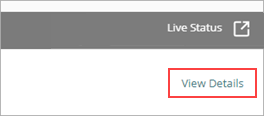
- To change the number of rows on the page, select a number from the drop-down list above the report.
- To go to a different page:
- To go forward or back one page, click Next or Back.
- To go to the first or last page, click << or >>.
- To go to a specific page, type a page number in the text box above the report and press Enter.
Export Reports
You can export reports to a file that you can download to your computer. You can export summary reports to a PDF file and export detail reports to a CSV file. The Authentication report can be exported to a PDF file.
When you export a report as a PDF or a CSV file, the time zone that appears in the exported file is the local time on the client computer, not UTC time.
To export a report:
- To export the report as a PDF, at the top right of the page, click
 .
.
To export the report as a CSV, at the top right of the page, click .
. - If the file does not download automatically, select to open or save the file.