Applies To: Cloud-managed Fireboxes, Locally-managed Fireboxes
An important part of network security is to gather messages from your security systems, to examine those records frequently, and to keep them in an archive for future reference. The Firebox creates log files with information about security related events. Review log messages to monitor your network security and activity, and to identify and address security risks.
A log file is a list of events, along with information about those events. An event is one activity that occurs on the Firebox. An example of an event is when the Firebox denies a packet. Your Firebox can also capture information about allowed events to give you a more complete picture of the activity on your network.
In Log Manager, you can see log messages for the Fireboxes that send log messages to WatchGuard Cloud.
The information that is available in the log messages list depends on the log type you select.
| Log Type | Result Information |
|---|---|
| Traffic Logs | Date-Time, Disposition, Source, Interface, Destination, Port, Interface, Protocol, Policy |
| Alarm Logs | Date-Time, Alarm Name, Message |
| Event Logs | Date-Time, Process, Priority, Message |
| Statistic Logs | Date-Time, Device, Statistic Logs |
| All | Date-Time, Type, Detailed Message |
WatchGuard Cloud stores diagnostic log messages sent by a Firebox, but they are not visible in Log Manager or Log Search. If you need to troubleshoot an issue, you can request these diagnostic log messages from WatchGuard Technical Support.
In Fireware v12.5.4 and higher, the Firebox sends diagnostic log messages to WatchGuard Cloud only when Support Access is enabled. For more information, see Support Access to Your Firebox.
See Log Messages in WatchGuard Cloud
Select Monitor > Devices and then select a folder or individual device. Select Logs > Log Manager to see the log messages the device sent to WatchGuard Cloud. You can see log messages even if the device status is not Connected.
The Log Manager page includes a log frequency graph that shows the range of log message data for your selected device. You can specify the time range to see log messages and can also filter the list of log messages by type.
Log Manager only shows log messages from the time period covered by the Data Retention License for a device. The system time on the Firebox that you want to generate reports for must be less than 8 hours from the current time. If the local Firebox time is more than 8 hours from the current time, WatchGuard Cloud does not accept the logs to generate the report.
To see log messages in WatchGuard Cloud:
- Log in to WatchGuard Cloud.
- Select Monitor > Devices.
- Select a folder or device.
- To select the date range for log messages, click
 .
.
-
From the list of reports, select Logs > Log Manager.
Log messages for the selected device or devices show, with traffic log messages shown by default. If you selected a folder, a Device column shows in the results. If you selected a FireCluster, Device and Serial Number columns show in the results.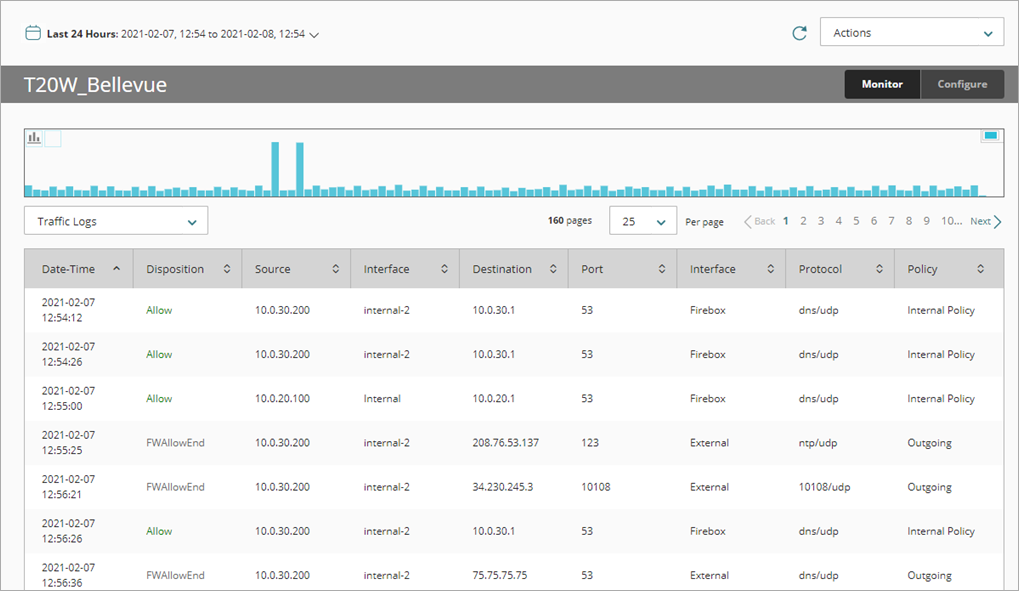
- To show log messages for a specific time period:
- Above the report, click the currently selected time period.
A drop-down list opens. - Select a predefined period from the list or select Custom and specify a custom time period. You can also drag within the chart to select a shorter time range. For more information, go to Filter Reports and Dashboards by Date.
- Above the report, click the currently selected time period.
If the search criteria are too broad, after 30 seconds, partial results are shown. You must reduce the time range.
If you select a date or date range that includes log messages from more than 10 days ago, a notification message appears. To receive a notification when the search completes, click Notify Me.
- To filter the log messages by a different type, from the drop-down list above the table, select a log message type.
The Log Messages list changes to only include messages of the selected log type. - To see a line chart of the log message data, click
 .
.
To see a bar chart of the log message data, click .
.
This is the default setting. - To zoom in on a section of the log frequency graph and see a smaller data set, place your mouse cursor over the graph, hold down the left mouse button, and drag the cursor to select a time range.
The log message list is updated based on your new selection. - To zoom out to the original time period, click
 .
. - To see more detailed information about a log message in the list, click that log message.
A dialog box opens with additional information about the log message.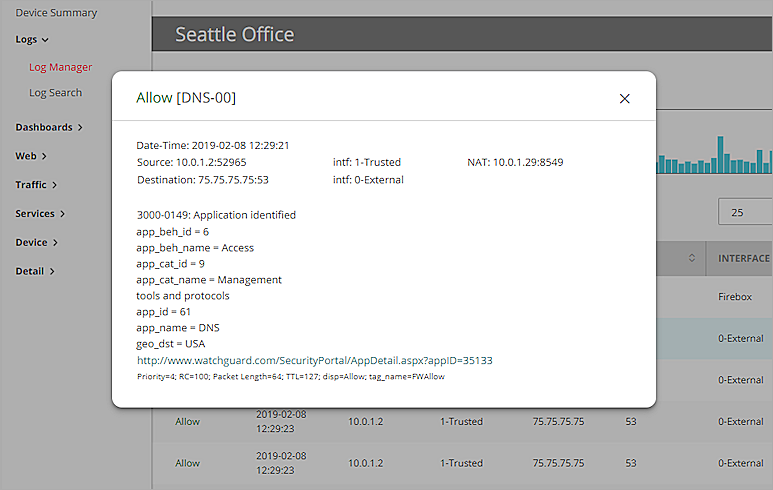
See a Timeslice Analysis
The Timeslice Analysis is a chart that shows the total number of log messages, the average arrival rate of log messages (per minute or per second), and the percentage of each type of log message sent to WatchGuard Cloud from a device in the specified time range.
To see a Timeslice Analysis for a device:
- Select the device.
- From the list of reports, select Logs > Log Manager.
Log messages for the selected device show, with traffic log messages shown by default. - From the Actions drop-down list, select Timeslice Analysis.
The Timeslice Analysis chart opens in a new dialog box.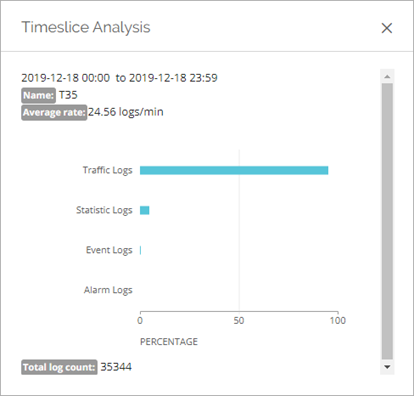
Export Log Messages
You can export log messages for a specified device and time range to a .CSV file. The .CSV file is automatically added to a ZIP file.
The .ZIP file name is the name of the device followed by the date and time range for the log messages. The .CSV file name is the log type followed by the date and time range.
The .CSV file can include up to 20,000 log messages. The time zone that shows in the .CSV file is the local time on the client computer, not UTC time.
To export log messages from WatchGuard Cloud:
- Select the device or folder.
- From the list of reports, select Logs > Log Manager.
Log messages for the selected device or devices show, with traffic log messages shown by default. - From the Actions drop-down list, select Export logs (.CSV).
- If the file does not download automatically, select to open or save the file.