Applies To: Cloud-managed Fireboxes, Locally-managed Fireboxes
On the Subscription Dashboard page in WatchGuard Cloud, you can see a high-level view of the activity for subscription services enabled on your Firebox for the date and time range you select.
A separate tile appears for each service that has traffic for the selected date and time range. The tiles include:
Blocked Websites
Includes the total number of HTTP requests and traffic that is denied by WebBlocker.
Virus (GAV)
Includes the total amount of traffic that was scanned, and the total number of viruses that were detected by Gateway AntiVirus.
Intrusions (IPS)
Includes the total amount of traffic that was scanned, and the total number of intrusions detected and prevented by the Intrusion Prevention Service.
Malware (APT)
Includes the total amount of traffic that was scanned, the total amount of advanced malware detected, the total amount of zero-day malware that was detected, and the total amount of content quarantined by APT Blocker.
Reputation Enabled Defense
Includes the total amount of traffic that was scanned, and the amount of good, bad, and inconclusive reputation score statistics for URLs that were scanned by Reputation Enabled Defense (RED).
Data Loss Violations (DLP)
Includes the total amount of traffic that was scanned, the amount of traffic denied for violations, and the amount of blocked and quarantined content that was scanned by Data Loss Prevention.
spamBlocker
Includes the total amount of traffic that was scanned, the amount of traffic that was denied for violations, and the amount of clean, confirmed spam, bulk, and suspected spam email that was identified by spamBlocker. (Bulk and Suspect spam categories are supported by Fireware v12.1.3 and lower, and Fireware v12.2.x to Fireware v12.5.3.)
Botnet Detection
Includes the total amount of traffic scanned, the total amount of traffic denied for violations, and the total amount of source and destination IP addresses that were scanned and blocked by Botnet Detection.
The Subscription Services Dashboard only appears if you have licensed and configured Subscription Services on your Firebox and if your Firebox has generated log messages for the configured Subscription Services.
If this dashboard is not available for your device, follow the steps to Enable Logging for this Dashboard.
See the Subscription Dashboard in WatchGuard Cloud
Each tile in the dashboard includes a graph of the data for the selected time range and a summary of the statistics. The graphs show the total amount of data scanned in green, and other statistics in red, orange, and yellow.
To see the Subscription Dashboard in WatchGuard Cloud:
- Log in to WatchGuard Cloud.
- Select Monitor > Devices.
- Select a folder or a specific device.
- To select the report date range, click
 .
.
-
From the list of reports, select Dashboards > Subscription Dashboard.
The Subscription Dashboard page opens for the selected device.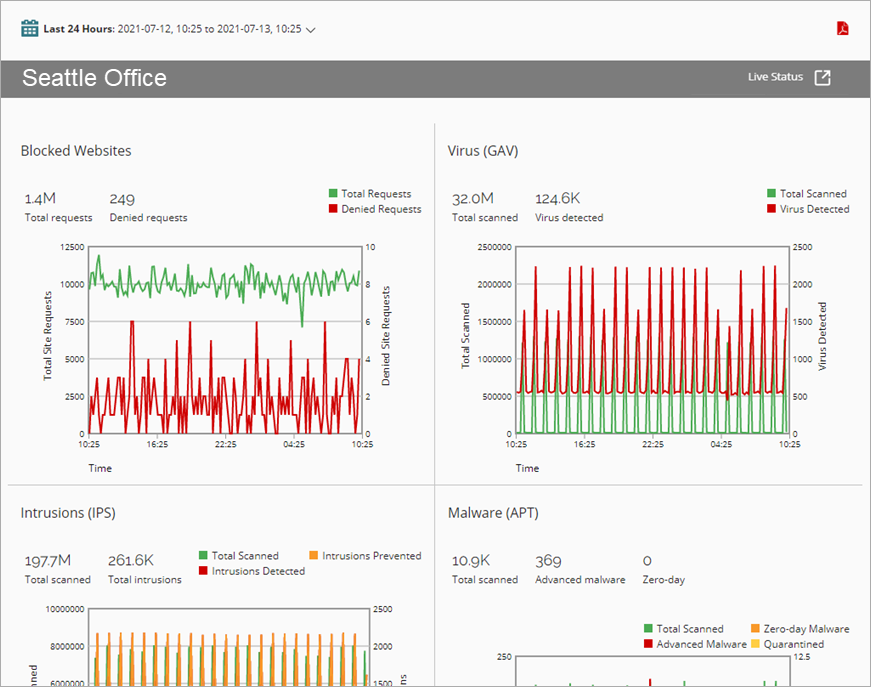
- To show data for a specific time period:
- Above the dashboard, click the currently selected time period.
A drop-down list opens. - Select a predefined period from the list or select Custom and specify a custom time period. For more information, see Filter Reports and Dashboards by Date.
The data in the dashboard changes based on the time range you specified.
- Above the dashboard, click the currently selected time period.
- To zoom in to a specific graph, put your mouse cursor over the graph, hold down the left mouse button, and drag the cursor to select a time range.
Generate the Subscription Dashboard Report
You can generate a summary report in PDF format that includes information from the Subscription Dashboard.
To generate the Subscription Dashboard report:
- Above the dashboard, click the PDF icon
 .
.
The file downloads or a confirmation message opens. - Select to open or save the file.
Enable Logging for this Dashboard
Logging for cloud-managed Fireboxes is automatically enabled. For locally-managed Fireboxes, you must manually enable logging in Fireware Web UI or Policy Manager. For more information, see Set Logging and Notification Preferences.
To collect the data required for this report for locally-managed Fireboxes, in Fireware Web UI or Policy Manager:
- In the Logging and Notification settings for all packet filters, select Send a log message for reports. For more information, see Set Logging and Notification Preferences.
- In the General Settings for all proxy actions, select Enable logging for reports.
- In Policy Manager, in the Setup > Logging dialog box, click Performance Statistics. Select the Security Services Statistics check box.
- In all APT Blocker actions, select the Log check boxes for threat levels. For more information, see Configure APT Blocker.
- In all DLP Sensor actions, select the Log check box. For more information, see Configure DLP Sensors.
- In the Gateway AntiVirus settings for a proxy action, select the Log check boxes for all Gateway AntiVirus actions. For more information, see Configure Gateway AntiVirus Actions.
- In the Intrusion Prevention settings, select the Log check box for threat levels with the Block and Drop actions. For more information, see Configure Intrusion Prevention.
- In all spamBlocker actions, select the Send a log message check box. For more information, see Activate and Configure spamBlocker.
- In all WebBlocker actions, select the Log check box for all categories and select the When a URL is uncategorized, Log this action check box. For more information, see Configure WebBlocker Categories.