Applies To: Cloud-managed Fireboxes, Locally-managed Fireboxes
On the Live Status > Networks > SD-WAN page, you can see detailed live status information for SD-WAN actions and Global Multi-WAN.
This page is available only when your cloud-managed Firebox, or locally-managed Firebox with cloud reporting, is connected to WatchGuard Cloud.
View SD-WAN Live Status
To open SD-WAN details for a cloud-managed Firebox or locally-managed Firebox with cloud reporting:
- Select Monitor > Devices.
- Select a Firebox.
The Device Summary page for the selected Firebox opens. - Select Live Status > Networks.
The Networks page opens. The page refreshes automatically every 30 seconds. - Select the SD-WAN tab.
- Click the SD-WAN action or Global Multi-WAN you want to see details for.
The details page opens.
You can see these details for each SD-WAN or Global Multi-WAN:
SD-WAN Name
The name of the SD-WAN action or Global Multi-WAN.
Method
The SD-WAN method (Failover or Round-Robin) or Global Multi-WAN method (Failover).
Failback
The Failback method (Immediate, Gradual, or Don't Fail Back). This setting appears only for Global Multi-WAN or an SD-WAN action that uses the Failover method.
Measurement Based Participation
Appears if you enable measurement-based participation for the SD-WAN action.
Networks Icons
The network icon color indicates the status of the network.
![]() For SD-WAN actions, a green icon indicates the network is active and qualified. For Global Multi-WAN, a green icon indicates the network is active.
For SD-WAN actions, a green icon indicates the network is active and qualified. For Global Multi-WAN, a green icon indicates the network is active.
![]() For SD-WAN actions, a red icon indicates the network is not qualified.
For SD-WAN actions, a red icon indicates the network is not qualified.
![]() For SD-WAN and Global Multi-WAN, a gray icon indicates the network is not active.
For SD-WAN and Global Multi-WAN, a gray icon indicates the network is not active.
A network is active when no physical link failure is detected, and if you enabled link monitoring, probes to the next hop are successful. A network is qualified if loss, latency, and jitter do not exceed the values that you specified in an SD-WAN action. For information about how the Firebox handles inactive and unqualified networks, see About SD-WAN Methods.
Networks appear in this list in the same order as in the SD-WAN action. The first network is the primary network. For the Failover SD-WAN method, the primary network is preferred if it qualified. For Global Multi-WAN, the primary network is preferred if it is active.
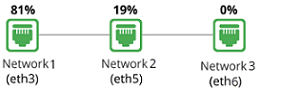
For the Round-Robin method, the network icon includes a percentage. This number indicates how traffic is load balanced across all qualified networks in the SD-WAN action.
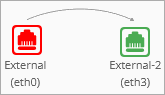
For an SD-WAN action that uses the Failover method, or for Global Multi-WAN, an arrow indicates that a network failed over to another network.
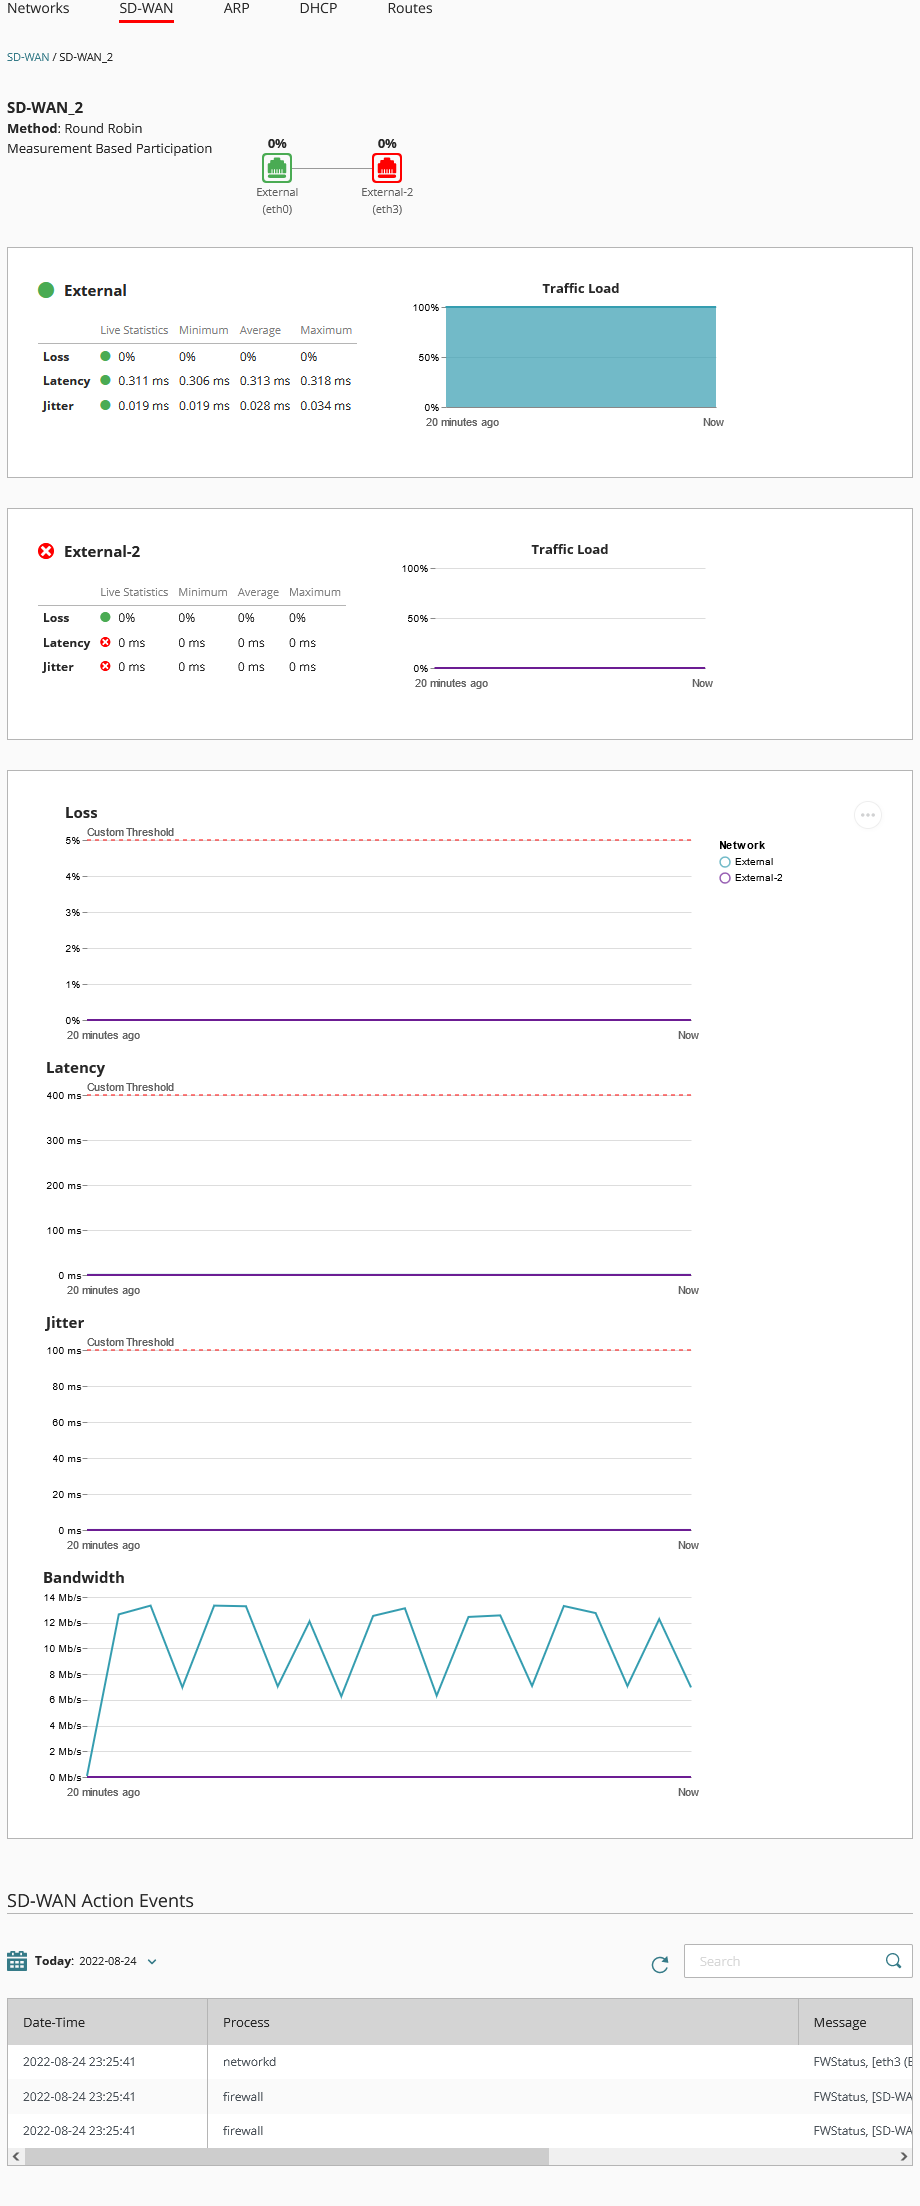
You can see these details for each network in the SD-WAN action or Global Multi-WAN:
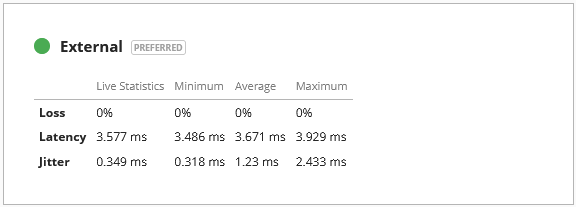
Live Statistics
For an SD-WAN action or Global Multi-WAN, you can see the live, minimum, average, and maximum statistics for these measures:
- Loss — Percentage of packets lost
- Latency — Packet delivery delay, measured in milliseconds (ms)
- Jitter — Variance in packet delivery delay, measured in milliseconds (ms)
For an SD-WAN action that uses the Failover method, or for Global Multi-WAN, the Preferred label indicates the network is currently the preferred network for traffic. For SD-WAN, the primary network is preferred if it is qualified. For Global Multi-WAN, the primary network is preferred if it is active.
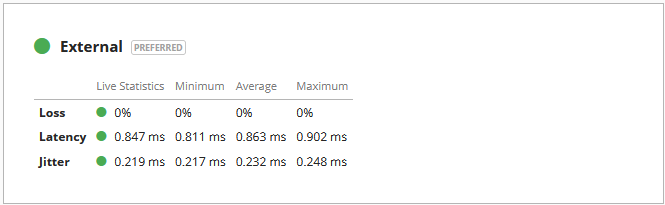
For SD-WAN, if you enable measurement-based participation, the icon color indicates the status of each measure:
![]() —The measure does not exceed the values you specified in the SD-WAN action.
—The measure does not exceed the values you specified in the SD-WAN action.
![]() — The measure exceeds the values you specified in the SD-WAN action.
— The measure exceeds the values you specified in the SD-WAN action.
If all icons for loss, latency, and jitter are green, the network icon is green. Green indicates the network is qualified, which means it is available for SD-WAN Round-Robin path selection or SD-WAN Failover.
If any icon for loss, latency, or jitter is red, the network icon is red. Red indicates the network is not qualified, which means it is not available for SD-WAN Round-Robin path selection or SD-WAN Failover.
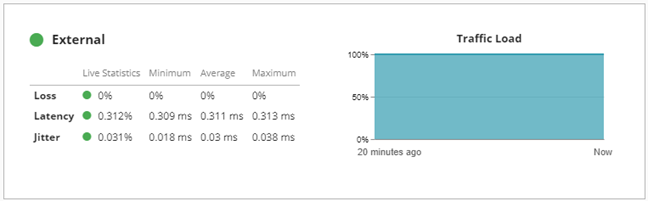
Traffic Load
For Global Multi-WAN and SD-WAN actions that use the Round-Robin method, a graph shows the percentage of traffic load on each network included in the Global Multi-WAN or SD-WAN action. The graph shows information for the last 20 minutes.
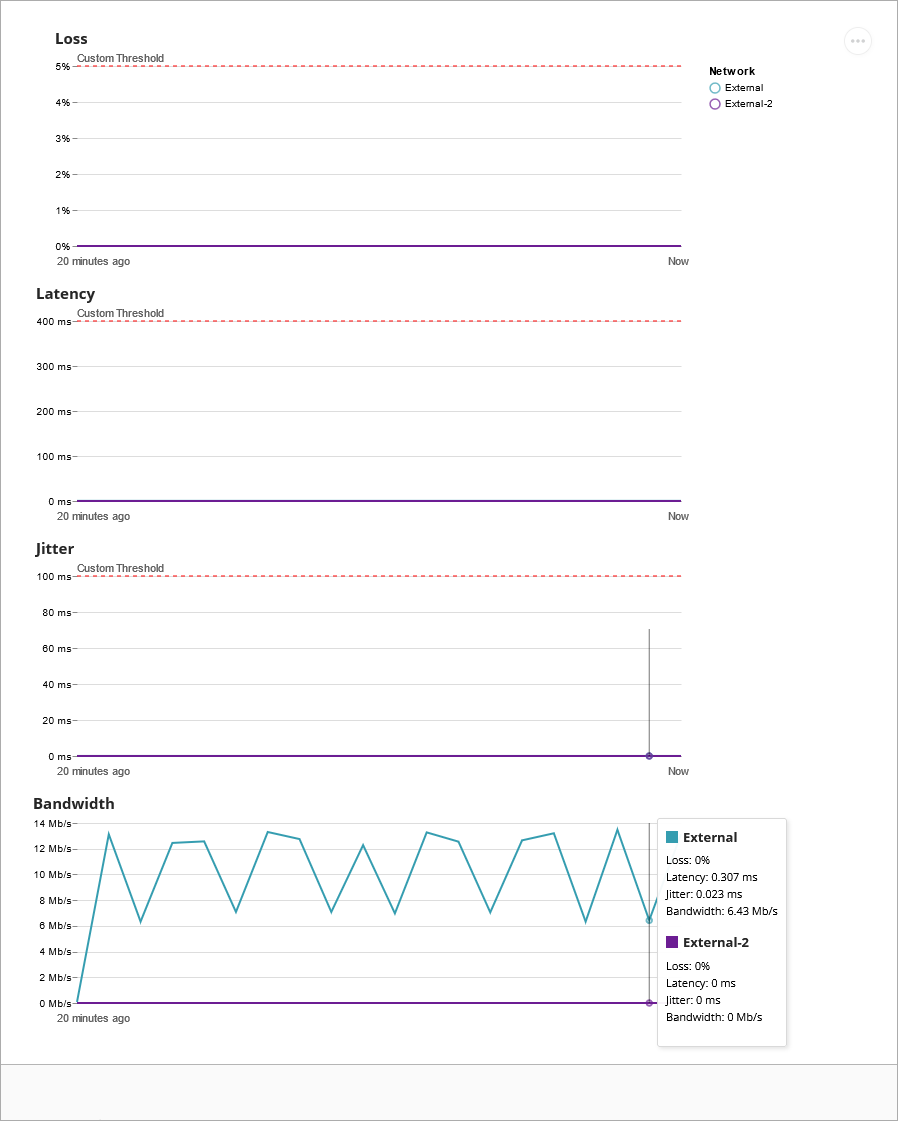
Line Graph
A line graph shows statistics for the network that you select. Statistics appear for last 20 minutes. From the Network list to the right of the chart, you can select a different network.
To see statistics for a specific point in time in the last 20 minutes, point to the area on the graph. Statistics for loss, latency, jitter, and bandwidth usage appear.
For an SD-WAN action configured to use the Failover method, a red Failoverline indicates the value that you entered for the measurement in the SD-WAN action.
For an SD-WAN action configured to use the Round-Robin method, a red Custom Threshold line indicates the value that you entered for the measurement in the SD-WAN action.
To save this graph as a .SVG or .PNG file, click ![]() .
.
For information about how to interpret SD-WAN live status information, see Interpret SD-WAN Data.
For information about how to generate a report, see SD-WAN Report.
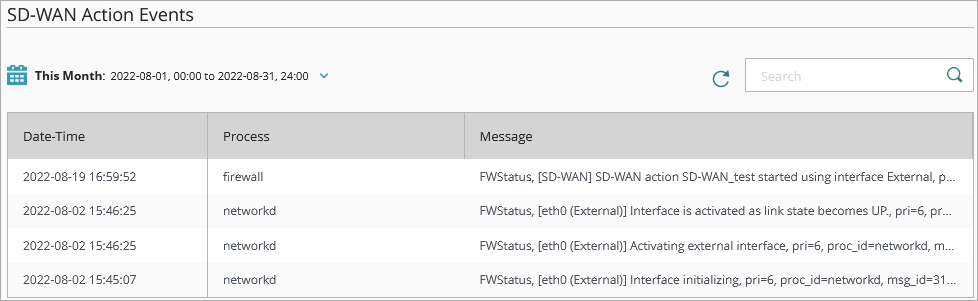
SD-WAN Action Events
A list of events related to Global Multi-WAN or SD-WAN actions.
To select the report date range, click ![]() .
.
To refresh the list, click ![]() .
.
To search the list, enter a word in the Search box and press Enter or click ![]() .
.