Applies To: Cloud-managed Fireboxes, Locally-managed Fireboxes
On the FireCluster page, you can view the live status of cloud-managed FireClusters and locally-managed FireClusters with cloud reporting enabled. You can also view historical events and a detailed report for each event.
This page is available only when your cloud-managed FireCluster, or locally-managed FireCluster with cloud reporting, is connected to WatchGuard Cloud. Both cluster members must run Fireware v12.8.2 or higher (or v12.5.11 or higher for T30, T35, T50, M200, and M300 Fireboxes).
To monitor FireClusters on cloud-managed Fireboxes and locally-managed Fireboxes with cloud reporting:
- Select Monitor > Devices.
- Select a Firebox.
The Device Summary page for the selected Firebox opens. - Select Live Status > FireCluster.
The FireCluster page opens.
To open live status in a new window, click  in the upper-right corner of the WatchGuard Cloud window.
The Event History graph shows a color-coded event history for both cluster members. The graph shows events from the past three months.
White (Both Members Down)
White graph sections indicate times when both clusters members were unavailable.
Orange (Single Member Up)
Orange graph sections indicate times when only one cluster member was unavailable.
Green (Both Members Up)
Green graph sections indicate times when both cluster members were available.
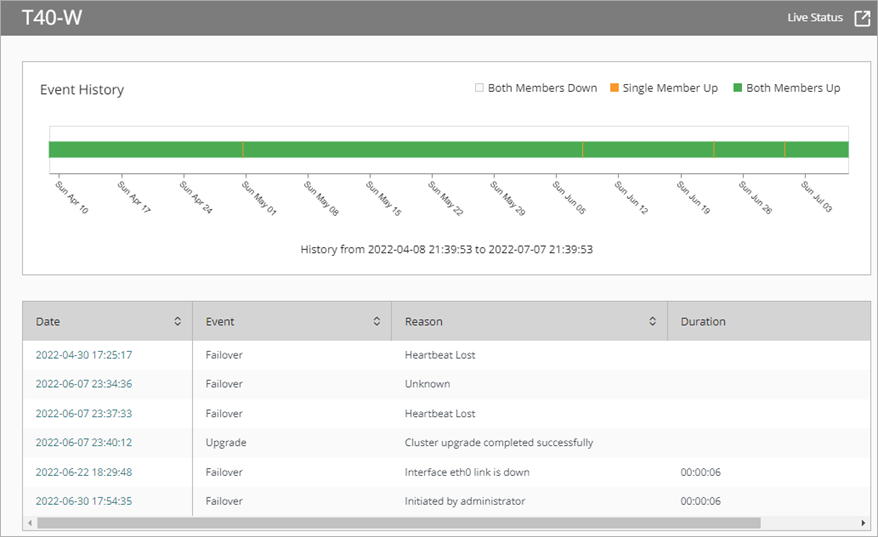
The events table includes cluster events that occurred in the last three months. The table includes these columns:
Date
The date and time that the cluster event occurred.
Event
The type of event that occurred, such as a failover or a firmware upgrade.
Reason
The reason that the event occurred, such as a lost heatbeat or firmware upgrade initiated by an administrator.
Duration
The amount of time that elapsed during the event.
To see a detailed report for an event, in the Date column, click the date for the event. The event report opens and includes this information:
Event description
The type of event, reason for the event, and the event time.
Runtime status
Whether cluster member are online and synchronized with each other, the percentage of CPU and memory usage, the number of Firebox connections, and the connection rate per second (CPS).
Cluster runtime status
The cluster ID, the current primary and backup cluster members, the status of all cluster interfaces, and the heartbeat threshold.
The cluster master sends a heartbeat packet through the primary and backup cluster interfaces once per second. If the backup master does not receive three consecutive heartbeats from the cluster master, this triggers failover of the cluster master. The default threshold for lost heartbeats is three.
These statuses are not supported: File TX Channel, Message TX Channel, KeepAlive Messages, and HeartBeat Messages.
Cluster health info
Scores for System Health Index (SHI), Monitored Ports Health Index (MPHI), and Weighted Avg Index (WAI). Each health index can have a value from 0 to 100.
The SHI indicates the status of monitored processes on the device. If all monitored processes are active, the SHI value is 100.
The MPH indicates the status of monitored ports. If all monitored ports are up, the SHI value is 100. The status of wireless connections are not monitored as part of this index.
The WAI is used to compare the overall health of two cluster members as a criteria for failover. The WAI for a cluster member is a weighted average of the SHI and MPHI for that device. If the WAI of the cluster master is lower than the WAI of the backup master, the cluster master fails over.
The Hardware Health Index (HHI) is disabled for cloud-managed FireClusters.
Cluster interfaces status
Whether an interface is up or down.
VPN synchronization
The number of active BOVPN tunnels.
Cluster operation events
A chronological list of events related to cluster operations, such as cluster formation, firmware upgrades, and cluster member role changes.

To download a .JSON version of the event report, click ![]() .
.
About FireCluster in WatchGuard Cloud