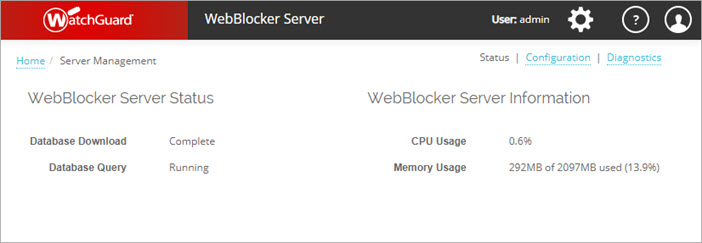
On the Server Management page Status tab, you can see the status of your WebBlocker Server.
- Select

 > Administration
 > Administration > Server Management.
The Server Management page appears with the Status tab selected.

- Review the information about your WebBlocker Server in the WebBlocker Server Status and WebBlocker Server Information sections.
WebBlocker Server Status
The WebBlocker Server Status section shows the current status of the WebBlocker Database.
Database Download
Database download status. Displays Pending when no database is available, Downloading when the database download is in progress, Indexing when the download process indexes data, Patching when the download process patches the database, and Complete when the download is complete.
Database Query
Database query service status. The status is Running when the service is running as expected. Before the database is downloaded for the first time, or if the service is not running, the status is Not Started.
WebBlocker Server Information
The Server Information section includes the current CPU Usage and Memory Usage statistics for your WebBlocker Server.
CPU Usage
The sum of the percentage of CPU that WebBlocker Server processes use on the available CPU cores. Because each CPU core can run at 100%, if the server processes use both CPU cores, the maximum is 200%.
Memory Usage
The amount of memory used on the WebBlocker Server. This is also shown as a percentage of the maximum available memory.
Configure WebBlocker Server General Settings