Monitor Link Aggregation Interfaces
Each link aggregation interface is identified by an interface number that starts with the prefix bond followed by a number. Link aggregation interfaces are numbered consecutively in the order they were added. For example, if you enable two link aggregation interfaces, the interface numbers are bond0 and bond1.
- In Firebox System Manager, link aggregation interface numbers appear in the Front Panel tab, Status Report tab, routes table, and log messages.
-
In Fireware Web UI, you can monitor the status of physical interfaces that are members of a link aggregation interface on the Interfaces dashboard. The Interfaces dashboard shows the status for each physical interface, including link aggregation members, but does not show the status of link aggregation interfaces. To monitor the status of link aggregation interfaces, you must use Firebox System Manager.
To monitor link aggregation interfaces, from Firebox System Manager:
- In WatchGuard System Manager, connect to the device.
- Click
 .
.
Firebox System Manager appears. - Double click the Interfaces entry to expand the interfaces list.
The link aggregation interfaces appear at the bottom of the list - Double-click the link aggregation interface (for example bond0) to expand it.
The network statistics and list of physical interface members appear.
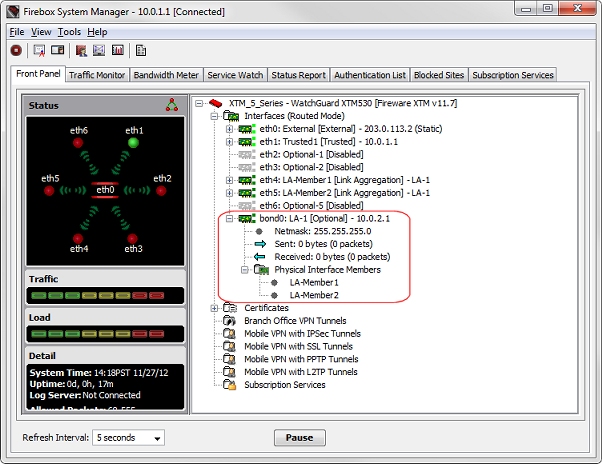
- Double-click Physical Interface Members to see a list of link aggregation interface members.
The network statistics for the link aggregation interface appears when you expand the link aggregation interface. To see network statistics for an individual physical interface, double click the interface to expand it.