From Firebox System Manager, you can identify a counter for any of the categories in the Available Counters list.
- Click
 .
.
Or, select Tools > Performance Console.
The Add Chart window appears.
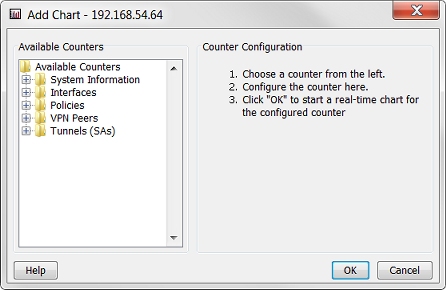
- In the Available Counters list, expand a counter category.
The available counters for that category appear. - Select a counter.
For example, CPU Utilization.
The Counter Configuration fields automatically refresh to show fields for the selected counter.
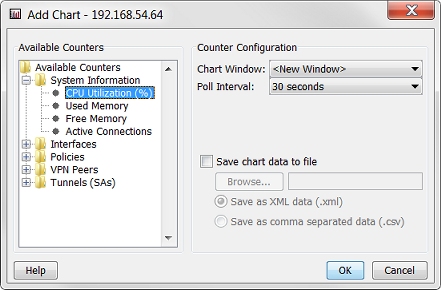
- From the Chart Window drop-down list, select <New Window> if you want the graph to appear in a new window.
Or, select the name of an open window to add the graph to that window. - From the Poll Interval drop-down list, select a time interval.
This is the amount of time that the Performance Console waits before it checks for updated information from the Firebox. - Add configuration information for the counter you selected. The configuration fields correspond to the counter, and different counters have different fields. The available fields include:
- Rate — Divide the value difference by the time difference: (value_2-value_1)/(time_2-time_1), (value_3-value_2)/(time_3-time_2), and so on.
- Difference — Subtract the previous value from the new value: value_2-value_1, value_3-value_2, and so on.
- Raw Value — Use only the value: value_1, value_2, and so on. The raw values are generally counters of content such as bytes or packets. Raw values can only increase, not decrease.
- To save the data collected by the Performance Console, select the Save Chart Data to File check box.
- Click Browse to select a location to save the file, and choose whether to save the file as an XML data file or a comma-separated data file.
Type
Select the type of graph to create in the drop-down list: Rate, Difference, or Raw Value.
For example, if you want to create a graph of value_1 at time_1, value_2 at time_2, and so on, by:
Interface
Select an interface to include in the graph data from the drop-down list.
Policy
(If you select a Policy counter)
Select a policy from your Firebox configuration to include in the graph data. You can update the policy list that appears in the Performance Console when you click Refresh Policy List.
Peer IP
(If you select a VPN Peers counter)
Select the IP address of a VPN endpoint to include in the graph data. You can update the list of VPN endpoints that appears in the Performance Console when you click Refresh Peer IP List.
Tunnel ID
(If you select a Tunnels counter)
Select the name of a VPN tunnel to include in the graph data. You can update the list of VPN tunnels that appears in the Performance Console when you click Refresh Tunnel ID List. If you do not know the tunnel ID for your VPN tunnel, check the Firebox System Manager Front Panel tab.
For example, you can open an XML data file in Microsoft Excel to see the counter value recorded for each polling interval. You can use other tools to merge data from more than one chart
- Click OK to start a real-time graph of this counter.
Graphs appear in a real-time chart window. You can show one graph in each window, or show many graphs in one window. Graphs automatically scale to fit the data and refresh every 5 seconds.
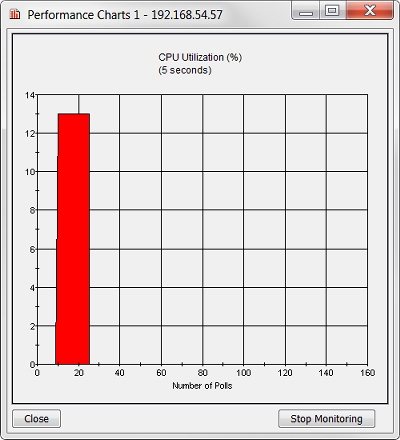
This performance graph shows CPU usage. You can use the same procedure to create graphs for other functions.