Each managed Firebox sends health statistics to Dimension every 15 minutes. The most recent information appears in the Health View section.
The Health list includes this information for each Firebox:
- Logging — Current status of the logging connection for the Firebox
- Managed — Current status of the management connection for the Firebox
- CPU usage — The percentage of the Firebox CPU in use
- Memory usage — The percentage of memory on the Firebox in use
- Uptime — The amount of time since the last Firebox reboot
- Feature key — The next date that a licensed feature on your Firebox will expire
You can sort the Health list by any column.
To see the Health list:
- Log in to Dimension.
The Devices page opens. - Select the Health tab.
The Health list appears.
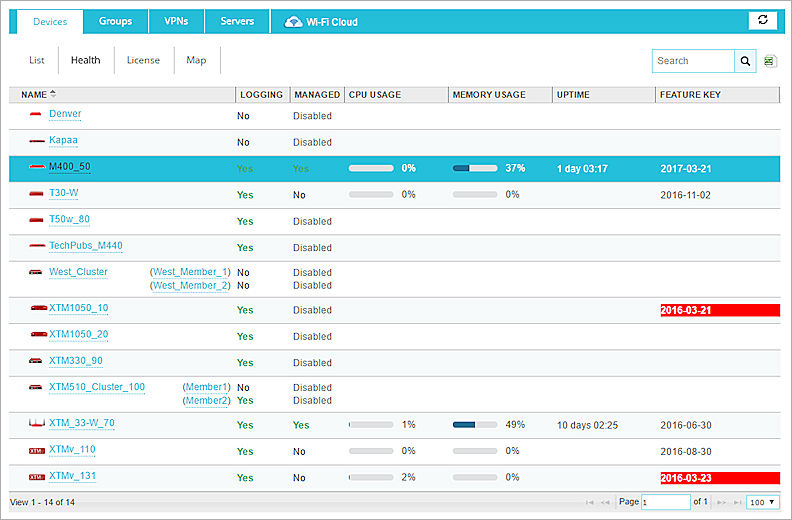
Example of the Health list with both managed Fireboxes and Fireboxes with only a logging connection.