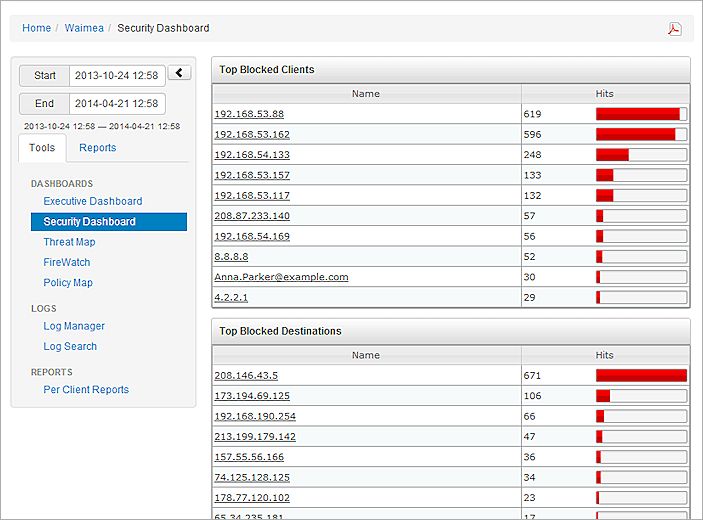
In Dimension, on the Security Dashboard page for any Firebox, FireCluster, or group, you can see the top threats in each security area protected by your configured Subscription Services, and take action on the threats. You can also add IP addresses and domains to the Blocked Sites List and to the Blocked Botnet Site Exceptions List from the Security Dashboard.
The Security Dashboard includes the top threats in these categories:
- Top Blocked Advanced Malware (APT)
- Top Blocked Botnet Sites
- Top Blocked Clients
- Top Blocked Mobile Devices
- Top Blocked Destinations
- Top Blocked URL Categories
- Top Blocked Applications
- Top Blocked Application Categories
- Top Blocked Protocols
- Top Blocked Attacks
Each of these categories only appears if there is data available in that category.
To enable Security Services Statistics for the Security Dashboard:
- In Policy Manager, select Setup > Logging.
- Click Performance Statistics.
- Select the Security Services Statistics check box.
To see the data in the Security Dashboard:
- In Dimension, select Home > Devices or Home > Groups.
The Devices or Groups page opens. - Select a Firebox or group in the list.
If the Firebox or group has only a logging connection to Dimension, the Executive Dashboard page opens.
If the Firebox or group has a management connection to Dimension, the Device Summary page opens. - If the Device Summary page appears, select Security Dashboard.
- From the Start and End drop-down list calendars, select the start and end dates to include in the report data, then click Apply.
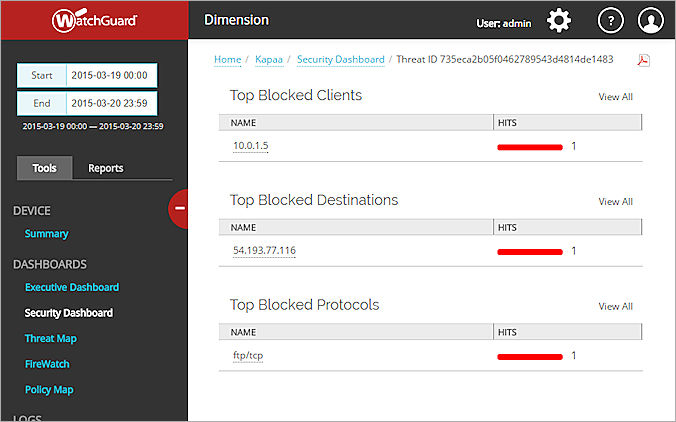
The top blocked threats in each category appear, for the selected date and time range.
- To see more information about any of the details in a category, click the link in the Name column.
For the Top Blocked Clients, Top Blocked Botnet Site, or Top Blocked Destinations categories, the detail dialog box appears when you click the link in the Name column. Click the Filter on link to see more details about that site.
The page data is refined based on your selection.
- To see all data for the a category, adjacent to the category section, click View All.
- To generate a PDF of the Executive Summary Report, click
 and select a location to save the PDF file.
If your Firebox has Botnet Detection enabled and there are log messages related to botnet traffic on your Firebox, when you have filtered on the details in a category, the Top Blocked Clients widget shows the top clients that were blocked when they tried to connect to a botnet site, and the Top Blocked Destination widget shows the top hosts that the botnet site tried to access.
Top Blocked Advanced Malware (APT )
The Top Blocked Advanced Malware (APT) widget shows the number of hits for each top blocked threat ID that APT Blocker has identified. Each row in the widget includes the content names for a different Threat ID, separated by commas. If there are more than two content names for a Threat ID, an ellipses (...) appears at the end of the line of content names, to indicate that there are additional content names for that Threat ID.
To see the additional content names:
In the Name column, place your mouse over the ellipses (...) in the Threat ID row.
A tool tip appears with the content names for the selected Threat ID.
Block a Site
From the Security Dashboard page, you can add an IP address to the Blocked Sites List or Botnet Sites Exceptions List for any site included in these sections:
- Top Blocked Clients
- Top Blocked Destinations
- Top Blocked Botnet Sites
To block a site:
- In the Top Blocked Clients, Top Blocked Destination, or Top Blocked Botnet Sites section, click the IP address of a site.
The detail dialog box appears for the selected site.
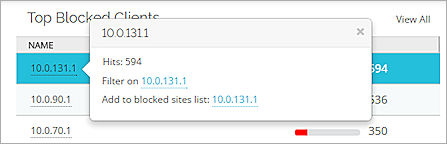
- Adjacent to Add to blocked sites list or Add to Botnet Sites Exception List, click the address link.
The Add to Blocked Sites or Add to Botnet Sites Exception List dialog box appears with all of the options completed. - (Optional) Modify any of the settings as necessary.
- Click OK.
The site is added to the Blocked Sites list or the Botnet Sites Exception List.
From the Security Dashboard page, you can open Fireware Web UI for application items that appear in the Application and Application Control categories. When you click the link to open the Web UI, the page in the Web UI where you can modify the settings to allow or deny the traffic appears.
To open Fireware Web UI:
- From the Security Dashboard page, click the application name in the Application or Application Control categories.
The detail dialog box opens for the selected application traffic. - Next to Open Fireware Web UI, click the link.
The related page in Fireware Web UI opens. - Modify the configuration of the selected feature as necessary.