WatchGuard System Manager (WSM) has menus and icons you can use to start other tools. WSM also has two tabs that you can use to monitor and manage your Fireboxes and environment: Device Status and Device Management.
Device Status
Information about a Firebox you connect to appears on the Device Status tab. The information that appears for the Firebox includes the status, IP address, and MAC address for each interface, and the installed certificates. It also includes the status of all virtual private network (VPN) tunnels.
Expanded information for each Firebox includes the IP address and subnet mask of each interface. It also includes:
- IP address and subnet mask of the default gateway (for external interfaces only)
- MAC (Media Access Control) address of the interface
- Number of packets sent and received on each interface since the last Firebox restart
Each Firebox can be in one of four possible states, as indicated by the icon:
-
 — (Normal operation) The Firebox is successfully sending data to WatchGuard System Manager.
-
 — The Firebox has a dynamic IP address and has not yet contacted the Management Server.
-
 — WatchGuard System Manager cannot make a network connection to the Firebox at this time.
-
 — The Firebox is being contacted for the first time or has not been contacted yet.
When you expand the Firebox Status tree, you can see information for the DNS servers, interfaces, certificates, and VPNs configured for the Firebox.
The DNS Servers section includes the IP address for each configured DNS server.
The interface information includes:
- The IP address of each Firebox interface and the configuration mode of the external interface.
- If FireCluster is configured, whether the FireCluster members are available. The time at which the configuration of the cluster members was last updated also appears.
If you expand the entries for each interface again, you can see:
- IP address, gateway, and netmask of each configured interface
- Media Access Control (MAC) address of each interface
- Number of bytes and packets sent and received since the last device restart
- Status of the physical link (an interface or link icon in color means an interface or link is configured, and a dark icon indicates the interface or link is down)
The Certificates section includes:
- Each certificate installed on the Firebox
- The current status of each certificate — Valid or Expired
The Branch Office VPN Tunnels section includes:
- Each BOVPN tunnel the Firebox is a member of
- The IP addresses for each BOVPN gateway
- The status of each gateway
Each Mobile VPN tunnel section includes:
- Each active Mobile VPN tunnel on the Firebox
- The IP addresses for each tunnel
- The protocol settings for each tunnel
- The status of each tunnel
Device Management
The Device Management tab has a navigation pane on the left and an information pane on the right. The navigation pane shows the connected WatchGuard Management Servers and their managed devices, managed VPNs, VPN Firewall Policy Templates, Security Templates, Device Configuration Templates, and Scheduled Tasks. If you expand a device list, you see the VPN resources (networks) behind the device. For more information, go to Add VPN Resources.
The Device Management tab is only available when you connect to a Management Server. For more information, go to Connect to Your Management Server with WSM.
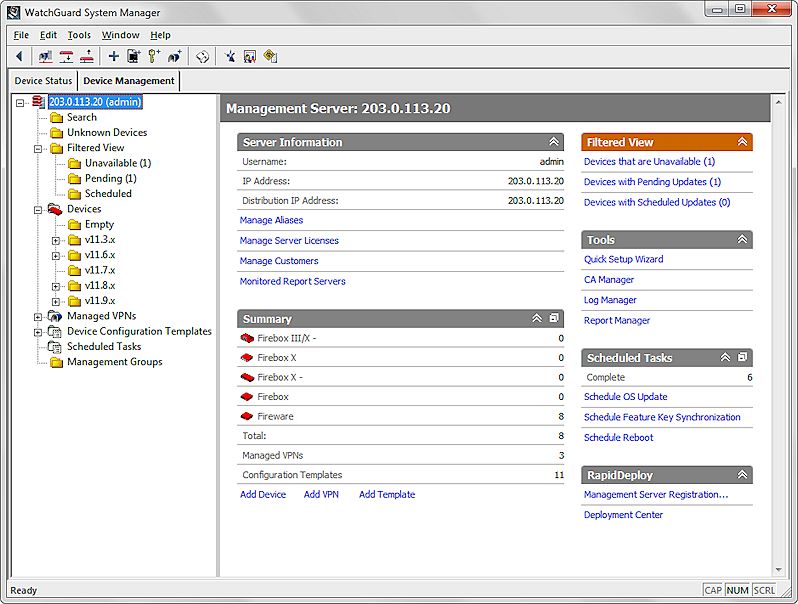
The information pane on the right shows more detailed information for any item you select in the navigation pane and enables you to complete certain tasks.
Management Server
To see or change information about the Management Server, select the Management Server in the navigation pane. The available information about the Management Server appears in the right pane and includes:
- User name and IP address of the user logged in to the Management Server
This user name is also included in parentheses after the IP address of the Management Server in the left navigation pane. - Manage Server Licenses and Restrict VPN Tunnel Authentication Options
- Customers — You can change the Contact List, as described in Set Device Management Properties
- Review and Manage the Monitored Report Servers List
- List of managed Fireboxes, VPN tunnels, and Device Configuration Templates
For more information, go to Quick Start — Add and Manage VPN Tunnels and Resources and Create Device Configuration Templates. - Filtered View — Information about managed devices, grouped by status and currently scheduled tasks
For more information, go to About Filtered View. - WatchGuard System Manager tools available for this Management Server
For more information, go to Start WatchGuard System Manager Tools. - List of currently scheduled tasks
For more information, go to Review, Cancel, or Delete Scheduled Tasks.
Search
To search for devices managed by the Management Server, select Search in the navigation pane. On the Search page, in the Search text box, type the name of the device to search for.
Unknown Devices
To see a list of Fireboxes that you have added to management that the Management Server does not recognize, select Unknown Devices in the navigation pane.
Filtered View
You can use Filtered View to see information about your managed devices (grouped by status) and scheduled tasks. The available categories are Unavailable, Pending, and Scheduled.
For more information, go to About Filtered View.
Devices
To see a list of Fireboxes managed by the Management Server, select Devices in the navigation pane. The Devices page appears and shows information about all the Fireboxes managed by this Management Server.
To see detailed information about a Firebox, in the Devices tree, select the Firebox.
Or, on the Devices page, double-click a Firebox. The Device Page for the selected Firebox appears.
For more information, go to Review Information for Managed Devices.
In the Devices tree, you can create folders to help you organize your Fireboxes.
For more information, go to Use Device Folders.
Managed VPNs
To see a list of existing VPN tunnels and add new VPN tunnels, select Managed VPNs in the navigation pane. On the Managed VPNs page, you can review basic details about your managed VPN tunnels. Double-click a managed VPN in the list to go to the Managed VPN page for that VPN tunnel. You can also click Add to Quick Start — Add and Manage VPN Tunnels and Resources.
To see information about an existing Managed VPN tunnel, select a managed VPN in the Managed VPNs tree. On the Managed VPN settings page, you can review the tunnel settings. Click Configure to Quick Start — Add and Manage VPN Tunnels and Resources.
Device Configuration Templates
You can use Device Configuration Templates to apply the same configuration settings to more than one managed Firebox.
For more information, go to Create Device Configuration Templates.
Management Groups
To make it easier to monitor which templates correspond to each of your fully managed Fireboxes, and to apply updated templates to your Fireboxes, you can use Management Groups.
For more information, go to Configure Management Groups.
Scheduled Tasks
To see the list of tasks that have been scheduled on your Management Server, from the navigation pane, select Scheduled Tasks. The list includes all current and past tasks that have been scheduled on your Management Server, that you have not manually removed.
Output Window
The Output window appears at the bottom of WSM and shows information about connections to your Fireboxes and Management Servers. The Output window includes the connection status of the Fireboxes or servers and success or failure messages for each connection.
To open the Output window, select Window > Output Window.
You can also save the log messages that appear in the Output window. For more information, go to About WSM Options.
Progress Window
The Progress dialog box appears when WSM connects to your Management Server or a Firebox, and shows the status of the connection task: None, Processing, Failed, Complete.
From the Progress dialog box, you can specify whether the dialog box closes automatically when the process completes. When the dialog box is configured to close automatically, if a task fails to complete, the dialog box stays open so you can review the failure message.
To open the Progress dialog box, select Window > Progress Window.
Configure a Firebox as a Managed Device
Review Information for Managed Devices
Quick Start — Add and Manage VPN Tunnels and Resources
Change the Centralized Management Mode