Applies To: WatchGuard Advanced Reporting Tool and Data Control
The Advanced Visualization Tool takes data from WatchGuard Advanced EPDR, EPDR, or EDR and presents it visually in dashboards that include sets of tiles. Some tiles are interactive — you can click specific elements and define filters based on those parameters.
This topic describes some of the common features on the dashboard and dashboard tiles.
If you have WatchGuard Data Control, this data is also presented visually in dashboards in the Advanced Visualization Tool.
Date Range Selector
The date range selector is at the top of each dashboard. The dashboard shows information for the date range you select from the drop-down lists.

When you set a wider date range (months or days), the data shows as a history or an evolution of activity over time. When you select a narrower range of dates, such as the current day, you can determine the current status of the personal data held by the company, but will lose the perspective of data over time.
Dashboard Screen Shot
To open a window with the entire contents of the tab in graph format, in the upper-right corner of the dashboard, click ![]() . You can download and print the graph.
. You can download and print the graph.
If your browser does not open the new window, allow pop-ups.
Options Menu
To view options for a section or tile, in the upper-right corner of the section or tile, click ![]() . Common options include:
. Common options include:
- Screenshot — Opens a window that shows the content of the tab in graph format so you can download and print it. If your browser does not open the new window, allow pop-ups.
- Download Data — Download the data on the page to a comma separated value (.CSV) file.
- Zoom — Zoom in to the section or tile.
- Go to Query — Open the data table associated with the section or tile. For more information, go to Create a Search Query.
Search Bar and Legend Bar
In some sections or tiles, you can use the search bar to filter the results on the tab. To filter the results, type text in the Search bar and press Enter.
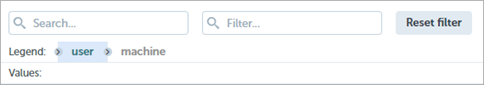
Use the legend bar to pivot the data to another element. For example, to pivot the data to show user name first and then machineName, drag user before machineName in the legend bar.