Applies To: WatchGuard Advanced Reporting Tool
The Application Control dashboard shows details of applications installed and executed on the network, which might include legitimate software used for malicious actions. You can use the Application Control dashboard to help identify applications that are unwanted, unauthorized, unlicensed, have known vulnerabilities, or consume a high amount of bandwidth, as well as scripting, remote access, or system tools.
To open the Application Control dashboard:
- In WatchGuard Cloud, select Monitor > Endpoints.
- Select Status > Advanced Visualization.
- From the left pane, select Advanced Reporting > Application Control.
- Select a time period to filter the data on.

- Click Refresh.
The dashboard shows information for the time period selected.
There are four tabs on the Application Control dashboard:
- IT Applications
- Vulnerable Applications
- Bandwidth-Consuming Applications
- Special Applications & Tools
IT Applications
The IT Applications tab shows which applications have run on network computers, and includes the Microsoft Office licenses in use.
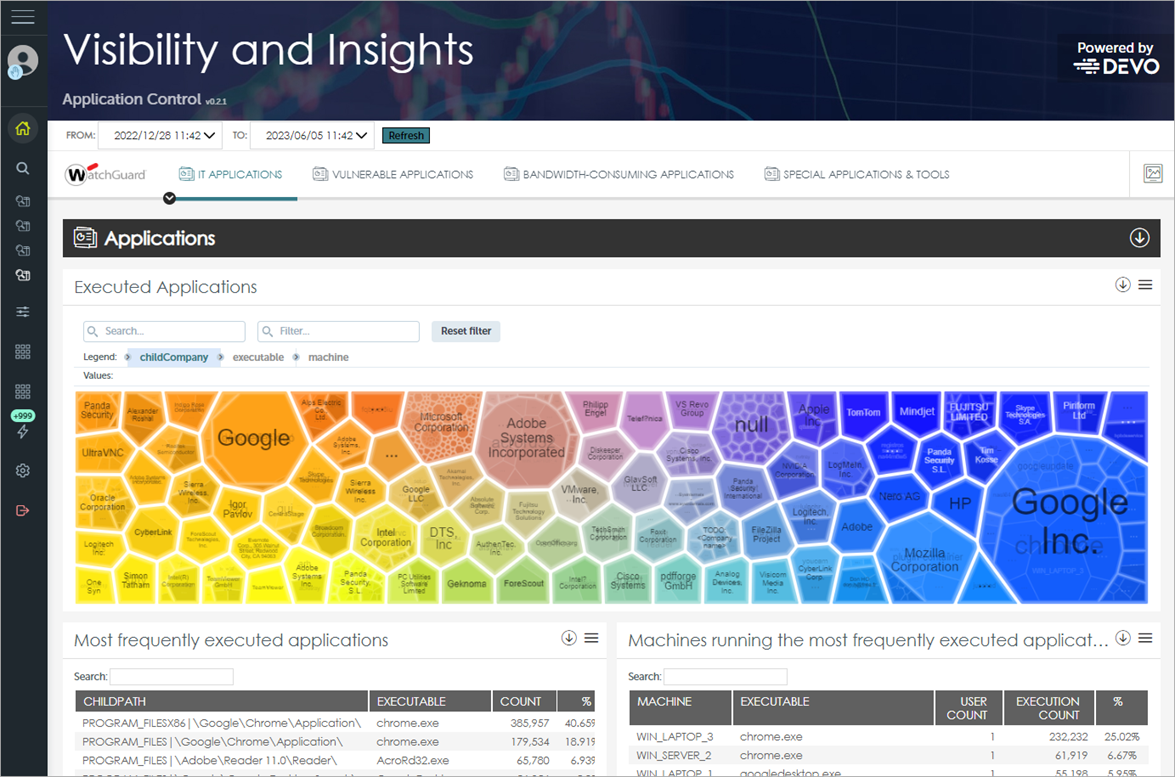
These tiles are available on the IT Applications tab:
Executed Applications
This tile shows the executed applications that run on the network as a percentage. It also shows the name of the executable, the path where it is located on the hard drive of the computer, and the computer on the network that ran it.
With the information in this tile, you can quickly identify the most frequently executed programs on the network, and detect the use of inappropriate or unlicensed software.
Most Frequently Executed Applications
This tile shows a list of the most frequently run applications on the network.
Machines Running the Most Frequently Executed Applications
This tile shows a list of the computers that run the most frequently executed applications.
Least Frequently Executed Applications
This tile shows a list of the applications least used on the network. It provides visibility into executed applications that could be missed by the IT department.
Machines Running the Least Frequently Executed Applications
This tile shows a list of computers that run the least used applications.
Microsoft Office Licenses in Use
This tile shows the Microsoft Office licenses used on the network and the number of users who have them.
Microsoft Office Applications in Use
This tile shows the Microsoft Office applications used on the network and the number of users who run them.
Microsoft Office Applications by User
This tile shows the number of users who ran a Microsoft Office application and the number of executions.
Vulnerable Applications
The Vulnerable Applications tab helps you to identify the vulnerable applications installed and executed on network computers. Use the charts to establish IT department priorities to update software with known vulnerabilities.
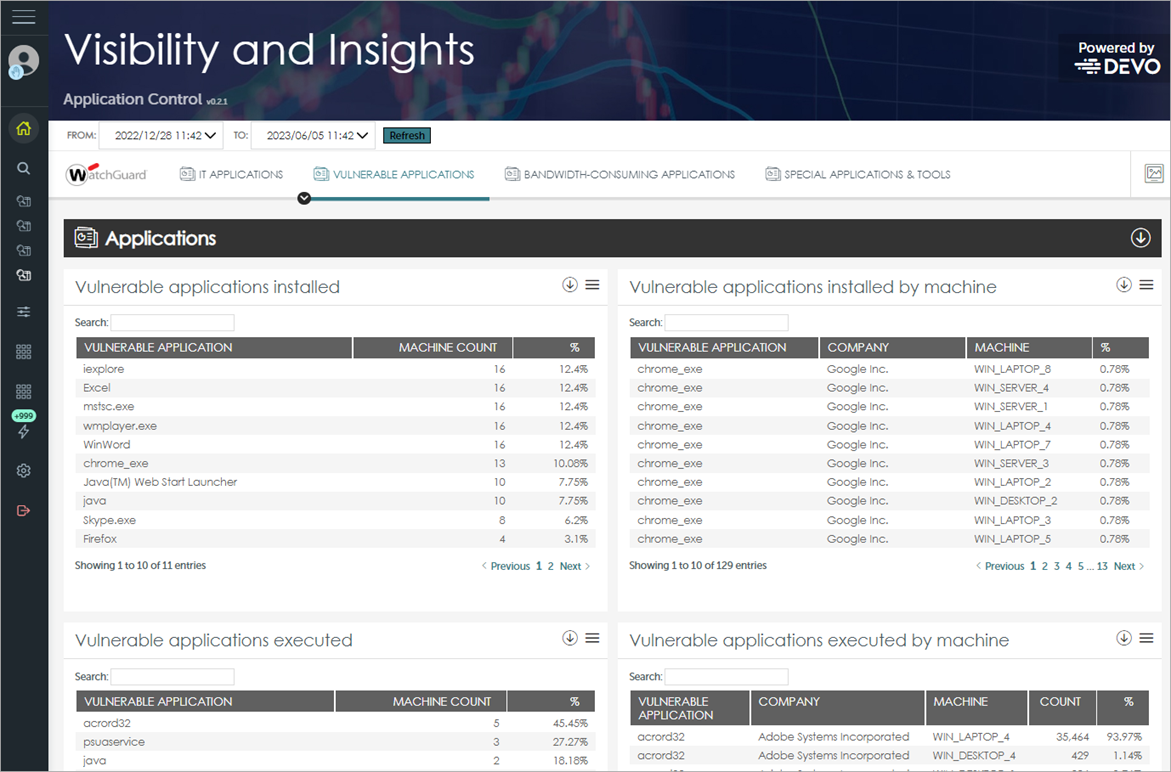
These tiles are available on the Vulnerable Applications tab:
Vulnerable Applications Installed
This tile shows the number of vulnerable software applications installed on the network.
Vulnerable Applications Installed by Machine
This tile shows the vulnerable software applications installed on the network and the computers where they are installed.
Vulnerable Applications Executed
This tile shows the vulnerable software applications run on the network.
Vulnerable Applications Executed by Machine
This tile shows the vulnerable software applications run on the network, their vendor, and the computer on which each application was run.
Bandwidth-Consuming Applications
The Bandwidth-Consuming Applications tab shows the volume and percentage of bandwidth consumed by the applications that run on the network. This tab provides an overview of the bandwidth consumption of the applications executed by users. Use this information to detect applications with above average consumption and to help determine optimum bandwidth provisioning across the organization.
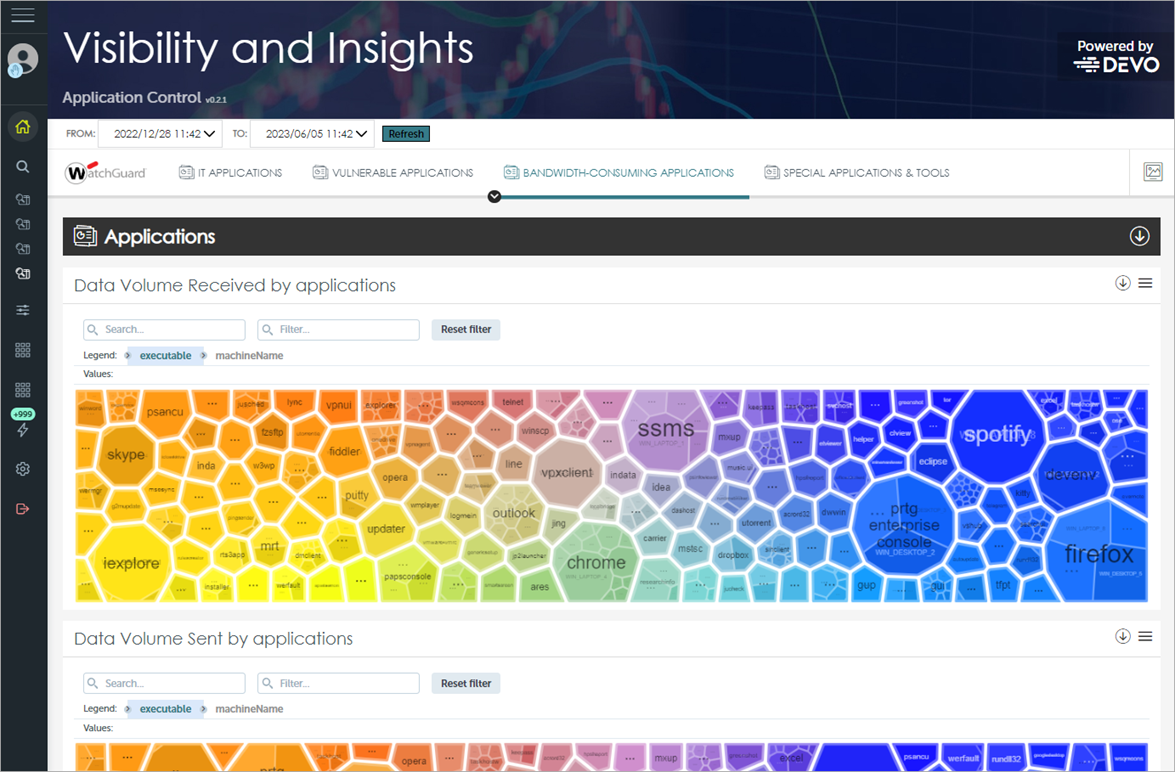
These tiles are available on the Bandwidth-Consuming Applications tab:
Data Volume Received by Applications
This tile shows the volume and percentage of bandwidth used by each application on the network, the path of the application, and the computer on which it ran.
Data Volume Sent by Applications
This tile shows the volume and percentage of bandwidth sent by each application on the network, the path of the application, and the computer on which it ran.
Special Applications & Tools
The Special Applications & Tools tab lists scripting, remote access, administrator, and system tools, as well as unwanted free software applications on the network. In addition, the Special Applications & Tools tab shows the user or computer that ran the application, and the number of times.
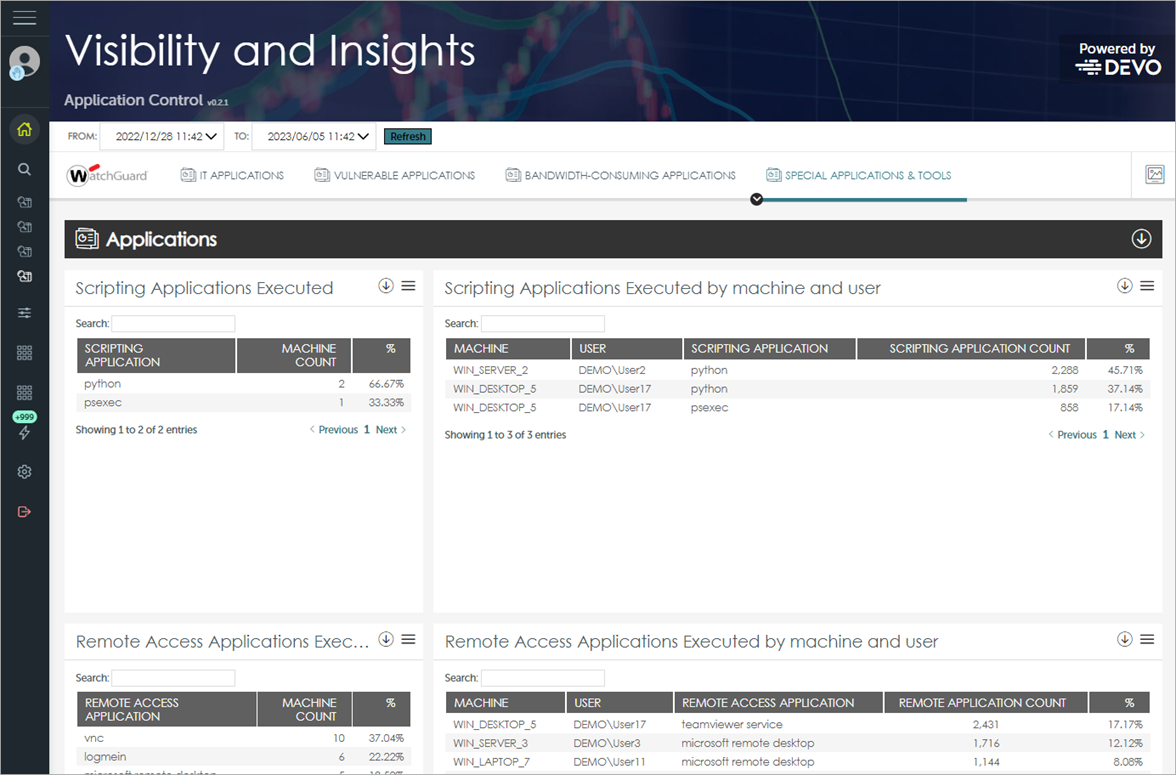
These tiles are available on the Special Applications & Tools tab:
Scripting Applications Executed
This tile shows the script interpreters or engines run on the network.
Scripting Applications Executed by Machine and User
This tile shows the scripting applications run by users on each computer.
Remote Access Applications Executed
This tile shows the remote access applications run on the network.
Remote Access Applications Executed by Machine and User
This tile shows the remote access applications run by users on each computer.
Admin Tools Executed
This tile shows the admin tools run on the network.
Admin Tools Executed by Machine and User
This tile shows the admin tools run by users on each computer.
System Tools Executed
This tile shows the system tools run on the network.
System Tools Executed by Machine and User
This tile shows the system tools run by users on each computer.
System Internal Tools Executed
This tile shows the system internal tools run on the network.
System Internal Tools Executed by Machine and User
This tile shows the system internal tools run by users on each computer.
Unwanted Freeware Applications Executed
This tile shows the unwanted freeware applications run on the network.
Unwanted Freeware Applications Executed by Machine and User
This tile shows the unwanted freeware applications run by users on each computer.
Executions of Vulnerable Apps Per Endpoint Today
This tile shows the number of vulnerable applications run in the last 24 hours by each network computer.
Bandwidth Consumption to Endpoint Hourly
This tile shows the bandwidth received in the last hour by each network computer.
Bandwidth Consumption from Endpoint Hourly
This tile shows the bandwidth sent in the last hour by each network computer.
Bandwidth Consumption Per Apps Hourly
This tile shows the bandwidth received and sent in the last hour by each application.