Applies To: WatchGuard Advanced EPDR, WatchGuard EPDR, WatchGuard EPP
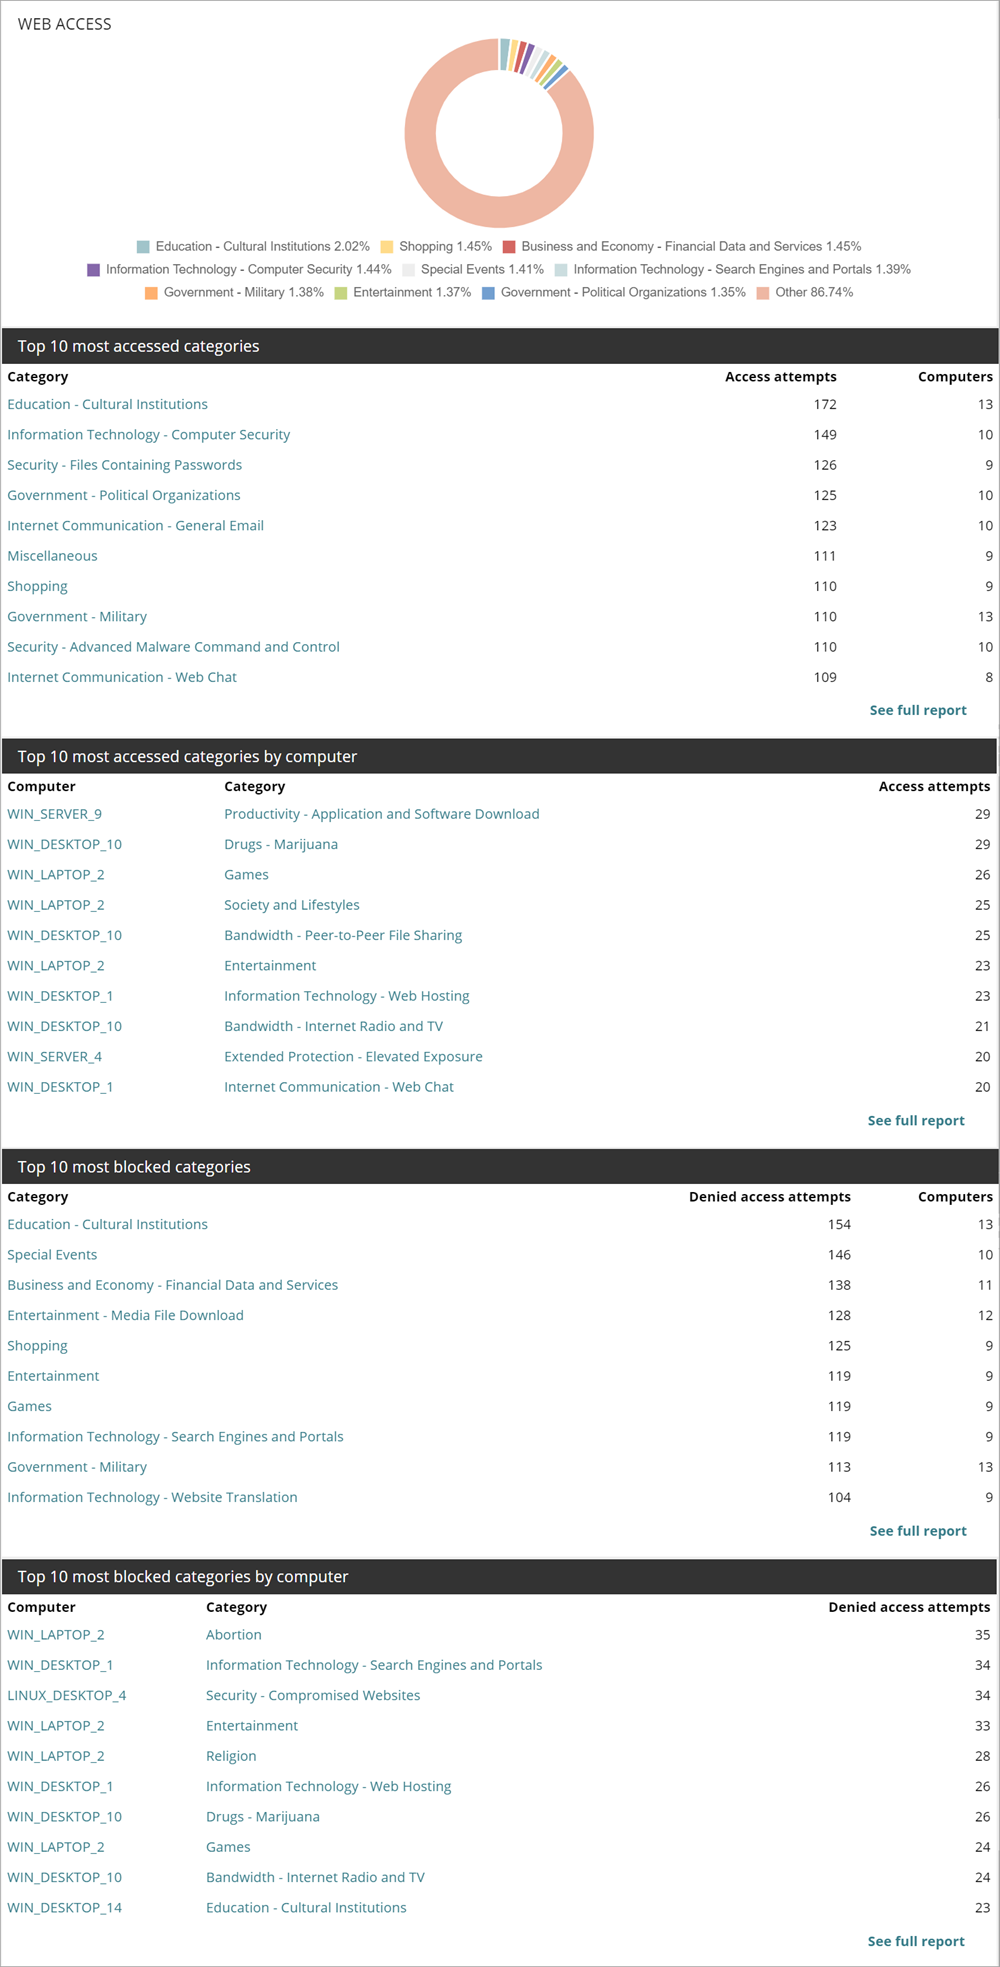
The Web Access dashboard shows information about blocked and filtered Internet content and unsolicited email. The pie chart shows the categories of web pages most visited by users on the network.
Time Period Selector
The Web Access dashboard shows information for the time period you select from the drop-down list.
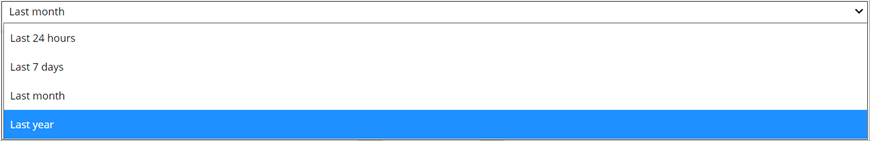
You can select these time periods:
- Last 24 hours
- Last 7 days
- Last month
- Last year
Tiles on the Web Access dashboard show information about web categories accessed and blocked, including:
- Top 10 most accessed categories — This panel shows the number of visits and the number of computers that have accessed the 10 most visited web page categories. Each category shows the total number of visits in the selected date range, and the number of computers that have accessed it one or more times.
- Top 10 most accessed categories by computer — This panel shows the number of web page visits, ordered by category, of the 10 computers that used the web the most.
- Top 10 most blocked categories — This panel shows the 10 most frequently blocked web page categories, the number of access attempts blocked, and the number of computers that attempted to access them and were blocked.
- Top 10 most blocked categories by computer — This panel shows the computer-category pairs with the most visits blocked, the name of the computer, the web content category, and the number of access attempt denied for each computer-category pair.
Click a row in a tile to see detailed information about the computers that accessed the category or were blocked.
About My Lists in WatchGuard Endpoint Security